
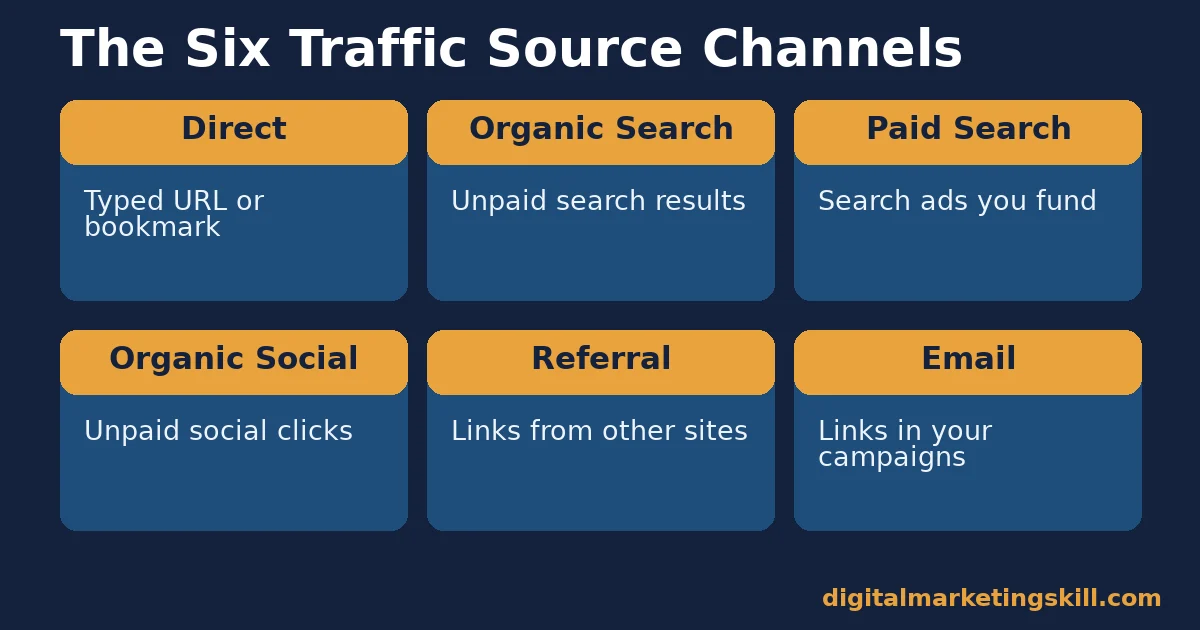
Google Analytics traffic sources group every visit into channels: organic search, paid search, organic social, referral, email and direct. Each channel means something different about how a visitor found you. Each one also needs a different response. Most site owners read the number of visits per channel and stop there. The real value sits one layer deeper, in what each channel is actually telling you.
Key Takeaways
- Six channels cover almost every visit. Google Analytics groups traffic into Direct, Organic Search, Paid Search, Organic Social, Referral and Email by default. Each one is defined by its own source and medium rules.
- Most searches never produce a click at all. SparkToro’s study of tens of millions of searches found 58.5% of US and 59.7% of EU Google searches ended with no click. Organic traffic is a small slice of total search activity.
- Google Analytics dominates the category. W3Techs found Google Analytics in use on 47.3% of all websites. Among sites using any traffic analysis tool, its share rises to 82.9%.
- Most pages get no organic traffic, so other channels matter more than they look. Ahrefs studied about 14 billion pages and found 96.55% get zero traffic from Google. The usual causes are low search demand, no backlinks, or a content format mismatch.
- Attribution choice changes which channel gets credit. Google Analytics offers multiple attribution models, including last-click and data-driven. The model you choose can shift credit between channels for the same visits.
In this guide
- What Most Advice on Google Analytics Traffic Sources Skips
- The Six Google Analytics Traffic Sources, Defined
- How to Read Your Own Channel Mix
- Common Mistakes When Reading Google Analytics Traffic Sources
- What to Do About Each Channel
- Why the Same Visit Can Get Credited to Different Channels
- How to Measure Progress by Channel
- The One Rule: Diversify Before You Optimise Further
- A Real Case: Building the Organic Search Channel From Scratch
- Frequently Asked Questions About Google Analytics Traffic Sources
- Start With Your Biggest Channel Gap, Then Build the Next One
What Most Advice on Google Analytics Traffic Sources Skips
Most guides explain how to find the traffic sources report. Few explain what to do once you are looking at it. A channel breakdown is not an answer. It is a starting point for six separate questions, one per channel. Each question draws on a different part of your digital marketing skills toolkit, so treating the whole report as one problem usually produces the wrong fix.
Here are the ground rules. The SparkToro and Ahrefs figures below come from large third-party studies with their own limits. SparkToro’s panel skews toward desktop. Ahrefs measures its own index, not the entire web. Treat both as informed estimates, not exact counts. The Google Analytics channel definitions are the platform’s own documentation. They describe how this specific tool classifies traffic. Another analytics platform may group the same visit differently.
Google Analytics traffic sources work the same way everywhere in your country. The channel definitions do not change by market. The mix of channels that matter to your business will. DataReportal’s Digital Global Overview Report counts more than 6 billion people online worldwide. Those people are spread across very different search, social and email habits by region.
The Six Google Analytics Traffic Sources, Defined
Google Analytics assigns every session a source and a medium. It then groups common combinations into six default channels, the same channels named in our overview of what digital marketing covers. Knowing the exact rule behind each channel matters. It explains why a visit sometimes lands somewhere you did not expect. It also explains why two visits that feel similar can end up in different rows of the same report.
Direct: No Referring Link Attached
Direct traffic comes, in Google’s own definition, “via a saved link or by entering your URL,” with source set to “(direct)” and medium to “(none)” or “(not set).” Typed URLs land here. So do bookmarks, and some links from apps or secure pages with stripped referrer data. A rising direct number often means stronger brand recall. It can also mean tracking gaps elsewhere, which is worth ruling out before you celebrate the trend.
Organic Search: Unpaid Search Results
Organic search covers visits from unpaid listings on search engines. This is the channel most content strategy targets, and it is also the hardest to win. Ahrefs found that 96.55% of roughly 14 billion pages it studied get zero traffic from Google. The usual reasons are low search demand, missing backlinks, or a mismatch between the content and what searchers actually want.
Paid Search: Search Ads You Fund Directly
Paid search covers clicks from search ads you are running. You control the spend and targeting here, so this channel is the most immediately adjustable. Raise or lower a bid, and the traffic responds within hours, unlike organic search. That speed makes paid search the fastest channel to test a new offer or a new keyword, even when you ultimately plan to win that traffic organically later.
Organic Social: Unpaid Visits From Social Platforms
Organic social covers unpaid clicks from social platforms. This channel depends heavily on each platform’s own distribution choices, which change without notice. A sudden drop here often reflects a platform-side shift rather than anything you did.
Referral: Other Websites Linking to You
Referral traffic arrives through links on other websites, excluding search engines and your own recognised social platforms. A healthy referral channel usually means other sites consider your content worth linking to. That tends to support organic search over time too.
Email: Visits From Email Campaigns
Email traffic comes from links in email campaigns, typically tagged with UTM parameters so Analytics can group them correctly. You own this list directly, unlike organic and paid search. That makes email one of the few Google Analytics traffic sources unaffected by a platform’s algorithm changes.
How to Read Your Own Channel Mix
A channel breakdown only becomes useful once you compare it against what each channel should be doing for your business, not against an industry average. Two businesses can show the exact same Google Analytics traffic sources split and need completely different responses, because one depends on that mix by design and the other drifted into it by accident.
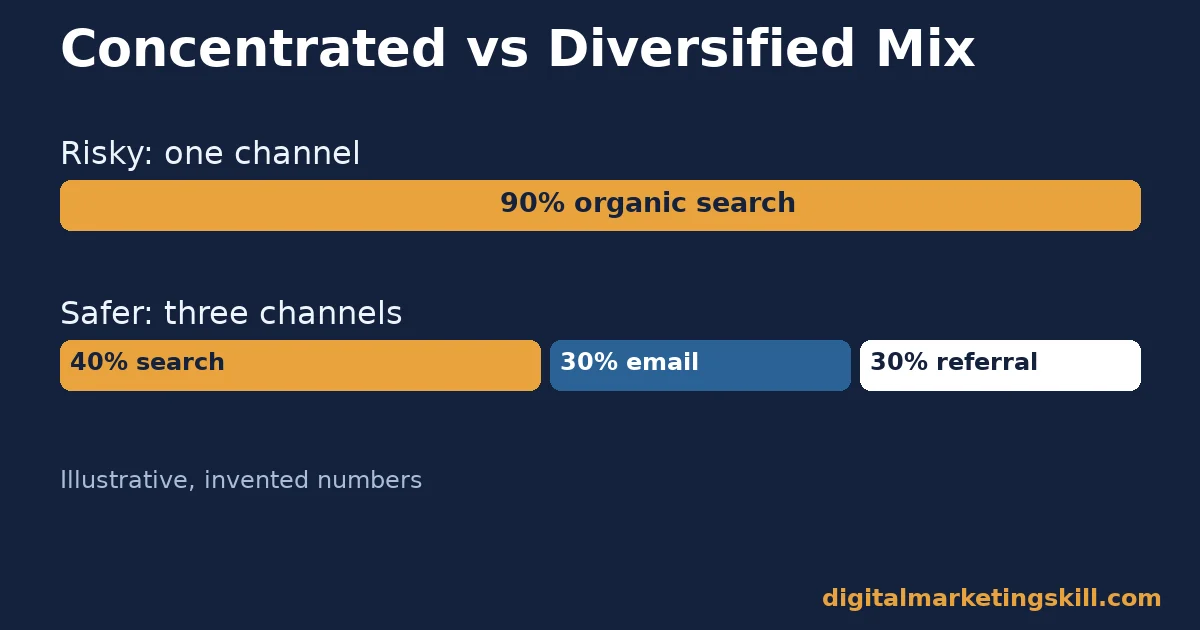
A Channel Mix Concentrated in One Source Is a Risk
A business getting most of its traffic from one channel is exposed to that channel’s single point of failure. An algorithm update, an ad account suspension, or a platform policy change can remove a large share of visits overnight. Spreading traffic across at least three of the six channels reduces that exposure meaningfully. None of the three needs to be large on its own. Together, they give you time to react if your largest channel suddenly drops.
Channel Volume Without Conversion Context Misleads
A channel that brings many visits but few results is not automatically a strength. Compare each channel’s visits against its conversions. Do this before deciding where to invest more time or budget, not after. A channel ranked first by raw traffic can easily rank last by actual results, and the reverse happens just as often.
Common Mistakes When Reading Google Analytics Traffic Sources
Two habits waste most of the value in a channel report, and both are easy to spot once you know to look for them.
Chasing the Biggest Number Instead of the Healthiest Mix
It is tempting to celebrate whichever channel brings the most visits and ignore the rest. That instinct rewards volume over resilience. A single dominant channel, however large, is still one policy change away from a steep drop. Treat the size of your smallest working channel as seriously as the size of your largest one. A small, steadily growing referral or email channel is often a better long-term signal than a large organic channel that depends entirely on a search engine’s current ranking of your pages.
Leaving Campaigns Untagged and Blaming “Direct” Traffic Later
Marketers often skip UTM tagging on a “quick” email or social post, then wonder why Direct traffic looks inflated weeks later. Every untagged link that strips its referrer adds noise to Direct and takes clarity away from the channel that actually earned the visit. Tag every link you control, every time, so your Google Analytics traffic sources report reflects reality. Build tagging into the process of publishing a link, not into an occasional cleanup task, because a backlog of untagged links is hard to fix retroactively once the visits have already landed in Direct.
What to Do About Each Channel
Once you know which Google Analytics traffic sources need attention, the fix differs by channel. Applying a search fix to a social problem wastes effort.
Organic Search: Fix the Demand-Content Match First
Before adding more content, check whether existing pages target topics people actually search for, using tools like those in our keyword research tools guide. Ahrefs’ same study found that a large share of zero-traffic pages fail on demand or format, not on quality alone. Matching the content to the query comes before polishing the writing.
Paid Search: Fix the Keyword and Budget Match
Paid search responds immediately to spend, so test changes here on a short cycle. Pause the keywords with the weakest conversion data. Reallocate that budget toward the terms already converting, rather than spreading a fixed budget evenly across everything.
Organic Social: Fix Over-Reliance on One Platform
If organic social traffic depends on a single platform, treat that as a concentration risk, not a success story. Build a presence on a second platform before a policy change on the first one removes the channel entirely. Start small on the second platform rather than splitting your effort evenly from day one, so the first platform’s results do not suffer while the second one gets established.
Referral: Fix the Reason Other Sites Would Link to You
Referral traffic grows when other sites have a real reason to link to you: original data, a useful tool, or a genuinely new angle on a common topic. Chasing links without that underlying reason rarely produces a lasting referral channel. Build one genuinely useful asset, publish it, and let other sites find their own reasons to link to it, rather than asking for links to pages that give them none.
Email: Fix List Health Before List Size
A large, inactive email list produces less traffic than a smaller, engaged one. Clean inactive subscribers periodically. Tag every campaign link with UTM parameters so Analytics can actually attribute the resulting visits to email rather than direct. A smaller list that opens and clicks consistently will usually move your Google Analytics traffic sources numbers more than a larger, stale one ever will.
Why the Same Visit Can Get Credited to Different Channels
Google Analytics offers more than one attribution model, including last-click models and a data-driven model that distributes credit across the touchpoints in a visitor’s path. Switching models can shift which channel appears to deserve credit for the same underlying visits, without any real change in behaviour.
This matters most when a visitor touches several channels before converting: an ad click, then a direct return visit days later, then a final search before buying. A last-click model credits only the search. A data-driven model spreads credit across all three. Pick one model and stay consistent with it across reporting periods, so your channel comparisons stay consistent over time rather than quietly shifting with the model.
This also explains a common source of confusion inside marketing teams: two people can look at the same Google Analytics traffic sources report, apply different attribution models without realising it, and walk away with conflicting conclusions about which channel deserves more budget. Agree on one model as a team standard before comparing numbers, not after a disagreement starts.
How to Measure Progress by Channel
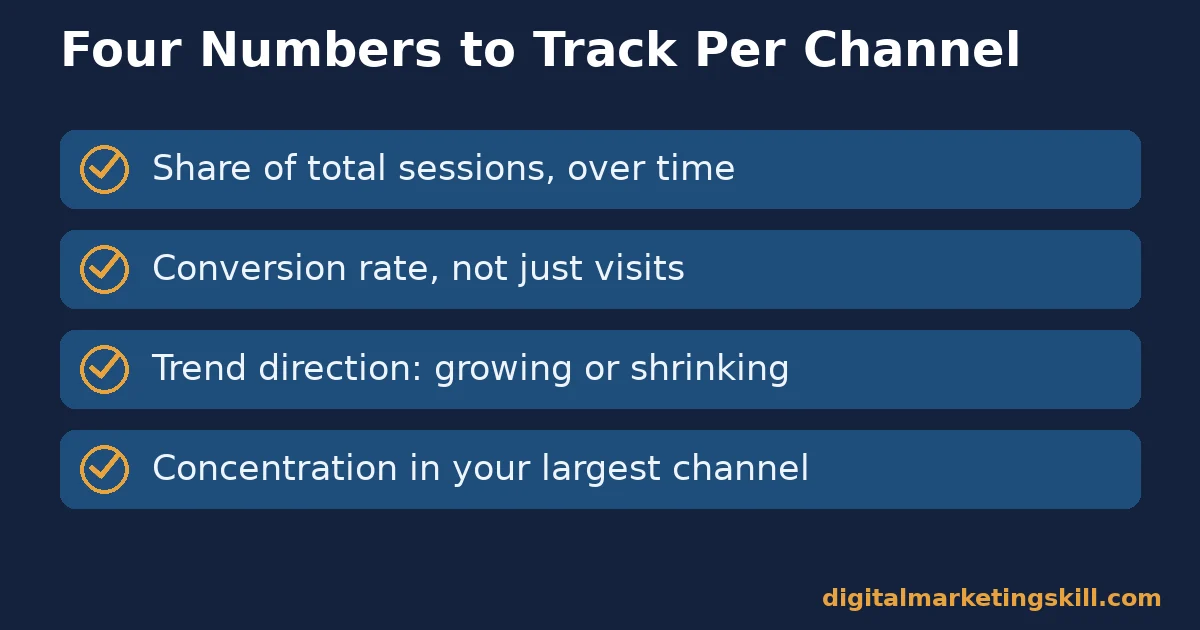
Track Google Analytics traffic sources against a short, consistent set of numbers rather than everything Analytics can show.
Four Numbers Worth Tracking Per Channel
- Share of total sessions. What percentage of your traffic each channel represents, tracked over time, not just a single snapshot.
- Conversion rate by channel. Whether a channel’s visits actually complete your key event, not just arrive.
- Trend direction. Whether each channel is growing, flat or shrinking over the last few reporting periods.
- Concentration. What share of total traffic your single largest channel represents, as a simple risk check.
Reading These Numbers Together
A channel with a shrinking share but a rising conversion rate may simply be getting more efficient, not failing. A channel with a growing share but a flat or falling conversion rate is adding volume without adding results. Read share and conversion rate together before deciding a channel needs fixing.
The One Rule: Diversify Before You Optimise Further
If one rule from this guide earns a place on a dashboard, make it this: before squeezing more performance from your best channel, check whether your channel mix is dangerously concentrated. A business with 80% of traffic in one channel gains less from optimising that channel further than it would from building a credible second and third channel. The marginal hour spent on a new channel usually buys more safety than the marginal hour spent perfecting an already-strong one.
Illustrative, invented numbers: a site with 90% of sessions from organic search improves its best-performing pages and gains 10% more organic traffic, a real but fragile win. The same effort spent building a referral and an email channel from near zero could instead remove a single point of failure that threatens 90% of the business’s visits at once.
A Real Case: Building the Organic Search Channel From Scratch
Among the outcomes published on Digital Marketing Skill Institute’s reviews page, graduate Abimbola Fafiolu describes building “a functioning website that ranks in Google,” naming the SEO module as the most useful part of the training. The account frames organic search as a channel built deliberately, not one that appears automatically once a site goes live.
Treat this as one documented account, not a guaranteed timeline; ranking speed depends on competition, topic and effort. The structural lesson still holds regardless of the specific numbers: organic search in your own Google Analytics traffic sources report reflects work done earlier, not luck, and it responds to the same demand-and-backlink pattern described above. A newly published site typically shows little or no organic search share for weeks or months, which is normal, not a sign that something is broken.
Frequently Asked Questions About Google Analytics Traffic Sources
Why does Google Analytics show so much “Direct” traffic?
Direct traffic includes typed URLs and bookmarks, but it also absorbs visits where the referring link was stripped or untagged, including some app and secure-page links. An unusually high Direct share often points to missing UTM tags somewhere else in your marketing, not a surge in brand loyalty alone. Audit your recent campaigns for untagged links before assuming the number reflects real brand strength.
What is the difference between organic social and referral traffic?
Organic social covers unpaid clicks from recognised social platforms specifically. Referral covers links from other websites generally, excluding search engines and those recognised social platforms. The distinction matters because the two channels respond to very different tactics. One follows platform algorithms. The other follows who finds your content worth citing. Mixing up the two can lead you to spend social media effort trying to fix what is actually a referral problem, or the reverse.
How many Google Analytics traffic sources should a small business focus on?
There is no fixed number, but relying on a single channel for most of your traffic is a risk worth addressing. Aim to build at least three functioning channels so no single algorithm or platform change can remove most of your visits at once. Add a new channel deliberately, one at a time, rather than attempting all six simultaneously with limited time or budget.
Does a high bounce rate mean a traffic source is bad?
Not necessarily. Some channels naturally bring visitors looking for a quick answer, who leave immediately once they have it. That is not failure; it is the channel doing its job well. Judge a channel by whether it supports your actual goal, not by bounce rate alone.
Why do my channel numbers change when I switch attribution models?
Different models distribute credit across a visitor’s path differently. A last-click model credits only the final touchpoint, while a data-driven model spreads credit across several. The underlying visits have not changed. Only which channel gets credit for them changes.
Should I trust Google Analytics channel data completely?
Treat it as a strong estimate, not an exact count. Ad blockers, cookie consent choices, and untagged links all create gaps. Use the channel breakdown to spot trends and proportions rather than to chase an exact visitor count. Directional accuracy, which channel is growing and which is shrinking, matters more here than the precision of any single number.
Start With Your Biggest Channel Gap, Then Build the Next One
Open your own Google Analytics traffic sources report, identify your most concentrated channel, and name the single next channel worth building. That one decision does more for long-term stability than another round of polishing the channel you already lead in. Write the name of that next channel down, along with one concrete first step, before you close the report, so the insight survives past the moment you noticed it.
Digital Marketing Skill Institute’s Master Diploma in Digital & AI Marketing covers Google Analytics alongside the channels it measures. Nine practical, AI-powered courses span SEO and content, Google Advertising and Analytics, email marketing automation, lead generation, and social media marketing and advertising. The program includes unlimited one-on-one mentoring and coaching, plus real project-based work experience inside a U.S. partner company from day one. The diploma is dual US and UK accredited and recognised in more than 100 countries, and it runs 100% online, so you can build a diversified channel mix from anywhere in your country.
Visit Digital Marketing Skill Institute for the fuller course breakdown, browse the blog for more analytics guides, and when you are ready to build a structured skill set, you can apply directly. You can start that process at digitalmarketingskill.com today.
Every figure in this guide was checked against its original source before publication. Figures marked as illustrative are invented examples, not real results.
![9 Amazing Digital Marketing Skills to Make Money Online [With Proof]](https://digitalmarketingskill.com/wp-content/uploads/2019/07/9-Amazing-Digital-Marketing-Skills-to-Make-Money-Online-With-Proof-17.png)






