

Website traffic analysis means reading visitor data in the right order. Check how many sessions actually engage, which channel really sent them, and where they lose interest. Most dashboards show the numbers but not the order. This guide walks through that order, with the metrics that matter most and a real case on why some channels look weaker than they are.
Key Takeaways
- Bounce rate is still a useful signal. Databox’s benchmark data, from over 2,000 companies, puts the median website bounce rate at 60.15%.
- “Engaged” has a precise definition. Google defines a GA4 engaged session as one that lasts longer than 10 seconds, has 2 or more page views, or triggers a key event.
- Some channels hide their own traffic. SparkToro’s study of 1,113 tracked visits found TikTok, Slack, Discord, Mastodon and WhatsApp all showed 100% of visits as “direct,” with no referral data at all.
- Scroll depth is simpler than it looks. GA4’s enhanced measurement fires a scroll event once per page, the first time a visitor reaches 90% of the page’s height.
- Search Console measures a different moment than GA4. It counts how often a link appeared and was clicked on Google itself, before the visitor ever reaches your site.
In this guide
- What Most Website Traffic Analysis Advice Gets Wrong
- How Website Traffic Data Actually Gets Generated
- What Differs by Traffic Channel
- How to Read Each Channel Correctly
- A Website Traffic Analysis Checklist, in Priority Order
- Building a Simple Weekly Traffic Review
- Common Mistakes in Website Traffic Analysis
- How to Measure Website Traffic Analysis
- The One Rule: Confirm the Channel Before You Judge It
- A Real Case: What Happens When You Actually Test Dark Social
- Frequently Asked Questions About Website Traffic Analysis
- Start With One Channel’s Full Picture
What Most Website Traffic Analysis Advice Gets Wrong
Most advice on website traffic analysis says the same thing: open Google Analytics and check your numbers. That is not wrong. But it skips the order. Without a sequence, it is easy to stare at a dashboard full of metrics and not know which one to act on first.
This guide treats website traffic analysis as a sequence. Confirm what you can trust. Read channels correctly. Then measure engagement and search visibility, in that order.
Here are the ground rules. The Databox and SparkToro figures are each one company’s dataset, not a universal law. Read them as informed snapshots. The SparkToro case later in this guide used a small panel, so treat its exact percentages as directional, not a fixed number for your own site. Treat every benchmark here the same way.
How Website Traffic Data Actually Gets Generated
Every visit becomes data only if two things happen. First, a tracking script has to load and fire before the visitor leaves. Second, that script has to receive, and correctly interpret, information about where the visitor came from.
Both steps can fail quietly. A fast-leaving visitor may never trigger a full page load, so the visit may not register at all on some setups. A visitor who clicked a link inside an app, a messaging platform or an encrypted referrer may arrive with no source information at all. Analytics tools file them under “direct” by default.
Neither failure shows up as an error. The numbers simply look smaller, or differently shaped, than reality.
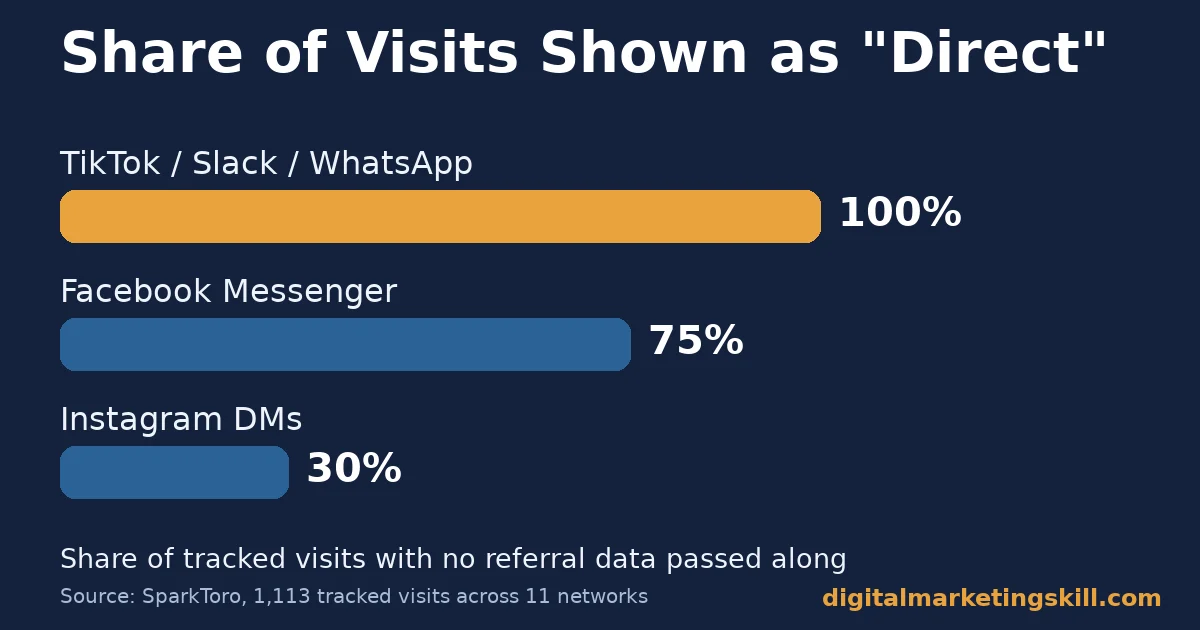
That second failure is larger than most teams assume. SparkToro and Really Good Data sent 1,113 tracked visits across 11 major social networks, to see how analytics tools labelled them.
Several platforms, including TikTok, Slack, Discord, Mastodon and WhatsApp, showed up as 100% direct traffic, with zero referral information passed along. Website traffic analysis has to account for this gap, before it draws conclusions about which channels are actually working.
What Differs by Traffic Channel
Different channels fail or succeed for different reasons. Reading them the same way produces the wrong conclusion more often than it produces the right one. A fix that helps organic search can do nothing, or even harm, a paid channel facing a different problem.
Organic Search: Built to Answer a Query
Organic visitors typed a question or phrase into a search engine. They clicked a result that looked like the best answer. Google Search Console defines clicks, impressions, CTR and position around that exact moment, before the visitor ever lands on your site. It measures visibility, not what happens after the click.
Direct and Dark Social: Built on Trust You Can’t Fully See
Some direct traffic really is someone typing your URL from memory or a bookmark. A large share of it, per the SparkToro findings above, is actually a link shared in a messaging app or social feed that analytics tools cannot trace. This traffic is real and often high-intent. But it looks like it came from nowhere.
Paid and Referral: Built on a Specific Click
Paid and referral visitors clicked a specific, trackable link. Their source data is usually reliable. The risk here is not misattribution. It is judging the channel by raw visits rather than by what those visitors did once they arrived.
How to Read Each Channel Correctly
The fixes below mirror the three channel groups above. Start with whichever channel drives the decisions you make most often, such as ad budget or content priorities.
Organic Search: Lead With Search Console, Not Just GA4
Pair Search Console’s impressions and position data with GA4’s on-site behaviour for the same pages. A page with rising impressions but flat clicks has a title or snippet problem. A page with good clicks but a high bounce rate has a content-match problem once the visitor arrives.
Direct and Dark Social: Lead With a Deliberate UTM Habit
Tag every link you personally share, in newsletters, social bios and partner messages, with a UTM parameter. You cannot fix every platform’s missing referral data. But tagging your own outbound links shrinks the share of traffic that falls into the unexplained “direct” bucket by mistake.
Paid and Referral: Lead With Post-Click Behaviour
Judge paid and referral traffic by engaged sessions and conversion rate, not raw visit counts. A channel sending fewer, more engaged visitors is usually worth more than one sending a larger number of visitors who leave in seconds. For the page-side half of this problem, our guide to landing page optimization covers matching the page to what each channel promised.
A Website Traffic Analysis Checklist, in Priority Order
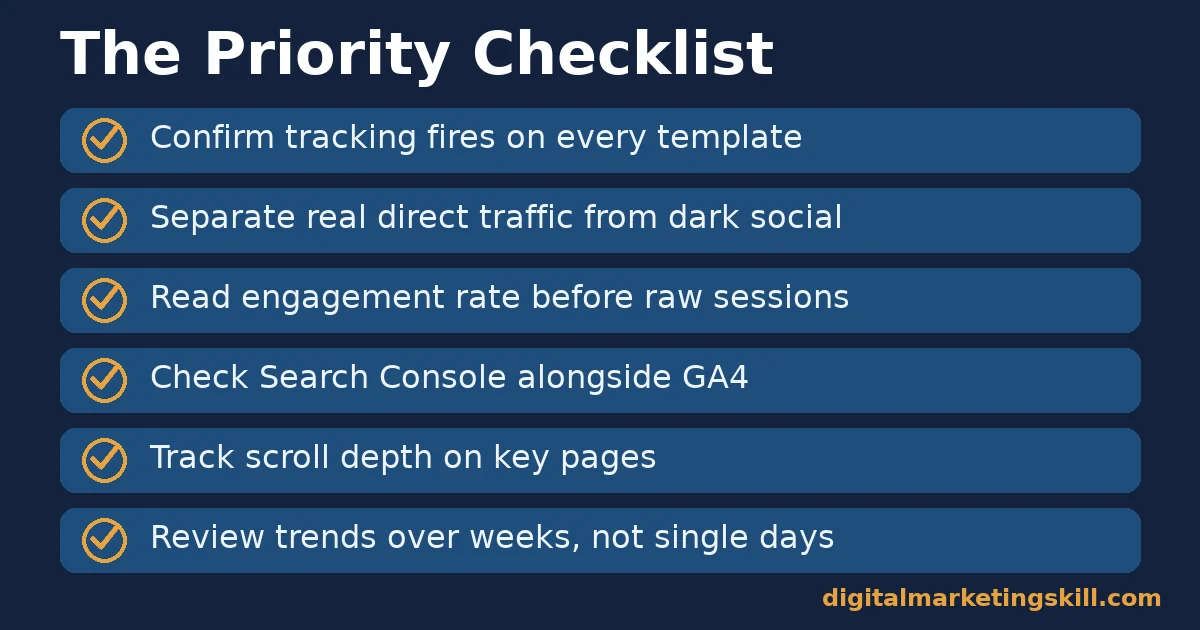
Work through this checklist in order each time you review your numbers. Each step depends on the one before it being correct.
- Confirm tracking is firing correctly. Check that your analytics code loads on every template, including any page built outside your main theme.
- Separate real direct traffic from dark social. Treat a large, stable direct number with suspicion rather than taking it at face value.
- Read engagement rate before raw sessions. A channel with fewer sessions but a higher engagement rate is usually the better channel to invest in.
- Check Search Console alongside GA4 for organic. Visibility and on-site behaviour are two different problems with two different fixes.
- Track scroll depth on your longest or most important pages. It shows whether visitors reach your call-to-action at all.
- Review trends over weeks, not single days. A single day’s numbers are noisy; a four-week trend is a signal.
For the content side of turning search visibility into real traffic, see our guide on how to optimize a blog post for search engines.
Building a Simple Weekly Traffic Review
A weekly review turns the checklist above into a habit instead of a one-time audit. It does not need a dedicated dashboard tool to start. A recurring 20-minute slot with the same five checks is enough to catch problems early.
Open the same four reports every time, in the same order: channel trend, engagement rate by channel, Search Console performance for your top pages, and scroll depth for your highest-priority page.
Write down one line for each: up, down or flat, compared with the previous four weeks. Over a quarter, those short notes become a record of what actually changed and when. That is far more useful than trying to remember a single dashboard glance from two months ago.
Keep the review separate from any decision to act. Note what changed first, then decide afterward whether it needs a response. Reacting inside the same five minutes you are reading the numbers tends to produce reactions to noise rather than to real trends.
Common Mistakes in Website Traffic Analysis
These mistakes show up across business sizes and industries. Each one leads to a confident decision built on an incomplete number. None of them require expensive tools to fix, only a more careful read of what the dashboard is actually showing.
Treating Bounce Rate as Universally Bad
Databox’s benchmark data puts the median bounce rate at 60.15% across more than 2,000 companies. A high bounce rate on a single-answer page, like a store’s hours or a definition, is often fine. The same number on a multi-step signup flow is a real problem.
Trusting the Direct Traffic Number at Face Value
Because of the dark social gap, “direct” traffic is really a mix of genuine direct visits and unlabelled clicks from messaging apps and social platforms. Treating it as a single, well-understood channel leads to under-crediting the content and relationships that quietly drive it.
Reporting Sessions Without Reporting Engagement
A session count on its own says nothing about whether visitors did anything. Google’s own engaged session definition, requiring 10 seconds, 2 page views or a key event, exists precisely because raw session counts can rise while real interest falls.
Reacting to One Day’s Numbers
Daily traffic swings for reasons that have nothing to do with your site: a holiday, a competitor’s campaign, a search algorithm update, a crawler spike. Website traffic analysis is more reliable as a weekly or monthly trend than as a daily scoreboard.
Mixing Up Sessions, Users and Pageviews
These three counts answer different questions. Mixing them up leads to the wrong read on a report. A session is one visit, bounded by inactivity or a new day. A user is a person, who might generate several sessions over a week. A pageview is one page loading, so a single session can contain several pageviews.
A report that drops the word “session” or “user” without saying which one it means is easy to misread. If a dashboard shows traffic “up 40%,” check whether that is more sessions, more distinct users, or simply more pageviews from the same group of people browsing more pages per visit.
How to Measure Website Traffic Analysis
These five metrics, read together, give a fuller picture than any single number. Each is defined in one sentence, with a note on how to read it.
Five Metrics That Explain Your Traffic
- Engagement rate. The share of sessions that qualify as engaged, under Google’s 10-second, 2-page-view or key-event definition. Compare it across channels, not just in total.
- Bounce rate. The inverse of engagement rate, roughly. Databox’s median across industries is 60.15%, so judge your own number against your past trend as much as this benchmark.
- Scroll depth. GA4 fires a scroll event once per page at 90% of its height. The share of visitors who trigger it shows how many read to the end.
- Search Console CTR. Clicks divided by impressions, for a specific query or page. A low CTR with a high position often points to a weak title or snippet, not a ranking problem.
- Channel trend over four weeks. The direction of a channel’s engaged sessions over a month, which smooths out daily noise and shows whether a channel is actually growing.
Reading These Numbers Together
Start with the channel trend. If a channel’s engaged sessions are falling over a month, check its bounce rate next. That shows whether the problem is traffic quality or the landing experience.
If organic search specifically is falling, cross-check Search Console. See if it is a visibility drop or a click-through drop, since each has a different fix. Treat scroll depth as a tie-breaker when the other two numbers look fine but conversions still lag. It often reveals that visitors are engaging but not reaching the part of the page that asks for the action you actually want.
The One Rule: Confirm the Channel Before You Judge It
If you take one decision rule from this guide, make it this one. Before deciding that a channel underperforms, confirm you are actually measuring that channel correctly. A channel that looks weak is sometimes just a channel whose traffic is being counted as something else.
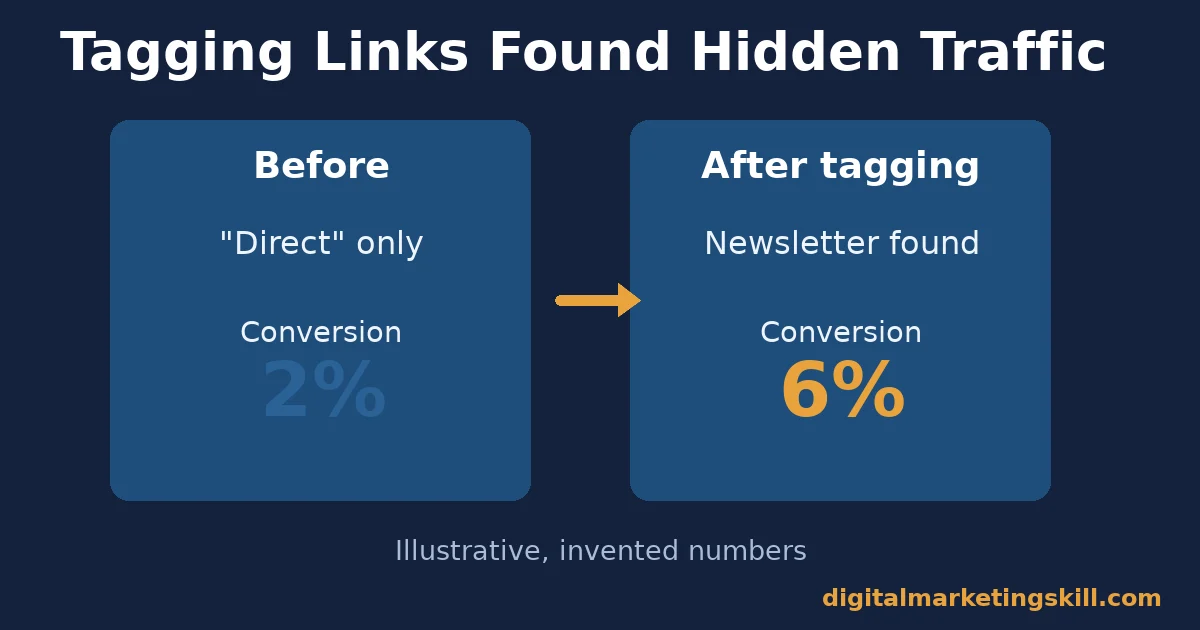
Here is an illustrative example, with invented numbers. A team sees “direct” traffic driving a 2% conversion rate, far below their paid channels. They consider cutting their newsletter, which they assume drives little traffic.
After tagging every newsletter link with UTM parameters, they find the newsletter was responsible for a third of what had been counted as direct traffic, and that segment converts at 6%.
The lesson is not that direct traffic is secretly great. It is that an unlabelled channel cannot be judged until it is actually labelled. The same caution applies in reverse: a channel that looks strong might also be absorbing credit that really belongs to something else entirely.
A Real Case: What Happens When You Actually Test Dark Social
Most discussion of dark social is theoretical. SparkToro and Really Good Data ran an actual experiment. They recruited a panel of about 100 participants and sent 1,113 tracked visits across 11 major social networks over 10 days, using 16 unique tracking URLs.
According to SparkToro’s write-up of the study, TikTok, Slack, Discord, Mastodon and WhatsApp all showed up as 100% direct traffic, with no referral data passed at all. Facebook Messenger showed 75% of visits with no referral information, and Instagram direct messages showed 30%. By contrast, YouTube and public posts on Instagram, Facebook and Twitter mostly passed referral data correctly.
The panel was small, around 100 participants over 10 days. Treat the exact percentages as directional rather than a fixed figure for every account. The broader lesson holds regardless of the exact numbers: website traffic analysis that treats “direct” as one clean category will systematically under-credit certain platforms.
What makes this case useful is the method, not just the headline figures. The researchers did not guess at dark social’s size from survey responses. They generated real, trackable visits and watched how each platform handled the referral data.
That is a repeatable approach you can borrow on a smaller scale. Send your own tagged links through the platforms your audience actually uses, then check what your analytics tool records for each one.
Frequently Asked Questions About Website Traffic Analysis
What is website traffic analysis?
Website traffic analysis is the practice of reading visitor data, such as sessions, engagement, channel source and search visibility, in a consistent order to find what is actually working and what needs attention.
What counts as an engaged session?
Google defines a GA4 engaged session as one that lasts longer than 10 seconds, includes 2 or more page views, or triggers a key event. A session needs to meet only one of those conditions.
What is a good bounce rate?
Databox’s benchmark data puts the median at 60.15% across more than 2,000 companies. Judge your own number against your site’s history and the type of page, rather than this figure alone.
Why does my direct traffic number look so high?
Some of it is genuinely direct. But a meaningful share is likely dark social traffic from messaging apps and platforms that do not pass referral data. Tagging your own shared links with UTM parameters is the most direct way to shrink this gap.
How is Search Console different from Google Analytics?
Search Console measures what happens on Google itself: impressions, clicks, CTR and position. Analytics measures what happens after someone lands on your site. You need both to understand organic search performance fully.
How often should I check my website traffic analysis?
Review trends weekly, and make decisions on four-week patterns rather than single days. Daily traffic is noisy for reasons unrelated to your site’s performance.
Does a high bounce rate always mean a problem?
No. A single-answer page, like a store’s hours or a quick definition, can have a high bounce rate and still be doing its job. A high bounce rate on a multi-step page is more concerning.
What should I measure first when traffic drops?
Check whether the drop is channel-specific or site-wide. Then check whether it is a visibility problem, in Search Console, or an engagement problem, in your analytics tool. The two have different fixes.
What’s the difference between a session, a user and a pageview?
A session is one visit. A user is a person, who may generate several sessions. A pageview is one page loading, and a single session can include several pageviews. Always check which one a report is actually counting before comparing it with a previous period.
Can I fully fix dark social traffic?
Not completely, since some platforms strip referral data on their end regardless of what you do. You can shrink the gap by tagging every link you personally share with UTM parameters. That at least separates your own tracked campaigns from the unexplained remainder.
Start With One Channel’s Full Picture
Website traffic analysis delivers the most value when you go deep on one channel before trying to fix all of them at once. Pick the channel that drives most of your decisions today, run it through the priority checklist above, and track its four-week trend before making any changes.
Digital Marketing Skill Institute teaches this hands-on inside the Master Diploma in Digital & AI Marketing. Its AI-Powered Google Specialist track covers analytics and search data directly, as one of four AI-powered tracks totalling ten courses, with a Full Stack option for all four.
It comes with unlimited 1-on-1 coaching and mentoring, plus a U.S. Project Internship with a verified U.S. Work Reference Letter. The diploma is dual US and UK accredited, and recognised in more than 100 countries.
The programme is 100% online, so you can study and apply these skills from anywhere in your country. Browse more guides on the Digital Marketing Skill Institute blog. When you are ready, apply for the Master Diploma or start from the Digital Marketing Skill Institute homepage.
Every figure in this guide was checked against its original source before publication. Figures marked as illustrative are invented examples, not real results.
![9 Amazing Digital Marketing Skills to Make Money Online [With Proof]](https://digitalmarketingskill.com/wp-content/uploads/2019/07/9-Amazing-Digital-Marketing-Skills-to-Make-Money-Online-With-Proof-17.png)






