

Google Analytics for beginners means learning one free tool. It turns anonymous site visits into a readable story: who arrived, what they clicked, and whether they bought, booked or left. Google Analytics 4 (GA4) tracks every action as an event. It groups events into sessions and reports both for free on any site.
Key Takeaways
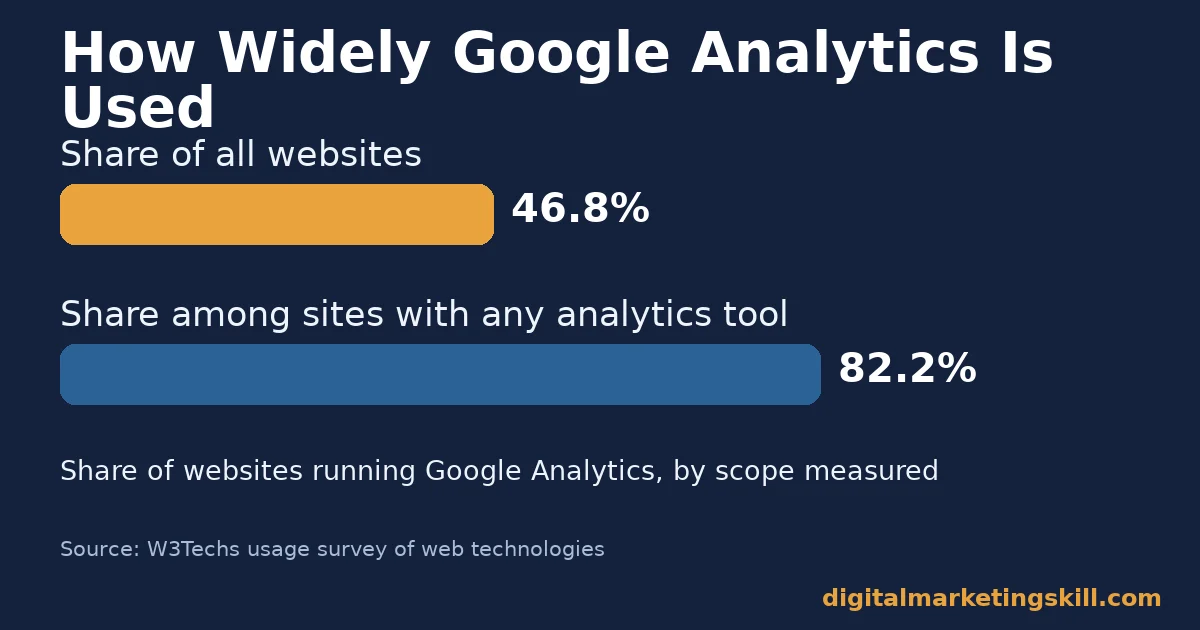
- Google Analytics is everywhere. It runs on 46.8% of all websites, according to W3Techs’ own usage survey. Among sites that use any known analytics tool, its share rises to 82.2%.
- Most searches never reach your site at all. A SparkToro analysis of US Google searches found that 68.01% ended without a click to any website. Analytics can only measure the traffic that actually arrives.
- A typical GA4 bounce rate sits in a band. GA4 benchmark research compiled by Lovesdata puts an average bounce rate at 45-55%. Under 35% counts as exceptional.
- Sessions are built, not counted directly. GA4 groups a user’s events into a session with a 30-minute inactivity timeout, per Google’s own developer documentation.
- Accounts have real limits. A single Google Analytics account can hold up to 2,000 properties. Most beginners never come close, per Google’s own support documentation.
In this guide
- What Google Analytics for Beginners Gets Wrong First
- Google Analytics for Beginners: How GA4 Actually Works
- What Changes Depending On Your Site Type
- How To Lead With Each Site Type’s Strongest Signal
- How To Read The Reports That Matter
- The One Rule: Mark A Key Event Before You Trust Any Report
- A Real Case: Why GA4 Replaced Universal Analytics At All
- Frequently Asked Questions About Google Analytics for Beginners
- Google Analytics for Beginners: Turn Reports Into Decisions
What Google Analytics for Beginners Gets Wrong First
Most introductions to Google Analytics for beginners start with a tour of the interface. Click here, then here, then look at this report. That tour is not the problem. The real problem is that beginners open ten reports at once and learn none of them well, because every report looks equally important on day one.
This guide takes a narrower path. It explains the one idea that makes every GA4 report make sense: everything is an event. It then shows how the reports that matter differ by the kind of site you run. It ends with a single decision rule for what to check each week.
A few ground rules first. The traffic-share and bounce-rate figures below come from research firms with their own published methods. Treat them as snapshots of a fast-moving market, not permanent rankings. Nothing here needs a paid Google Analytics 360 subscription. And nothing here is country-specific: GA4 works the same wherever your visitors are.
Google Analytics for Beginners: How GA4 Actually Works
Older analytics tools built reports around sessions and pageviews first. That included Universal Analytics, the product GA4 replaced. GA4 flips that order. It records every action, a pageview, a scroll, a click, a purchase, as an event with its own name and parameters. GA4 then calculates sessions and pageviews from that event stream, rather than tracking them as their own data type, as Google’s own developer documentation on sessions explains.
That single change explains most of the confusion when moving from an older report layout. A metric that used to live in its own tab, like “events” or “goals,” is now just a filtered view of the same event table. Once you accept that everything is an event, the rest of the interface mostly comes down to which events you choose to watch. A marketing campaign is really just a label attached to a cluster of events, so this event-first view carries over naturally once you start building campaigns.
Why Events Replaced Sessions As The Core Unit
Session-based tracking struggled with one thing: a visitor who used your site on a phone, then again on a laptop, looked like two separate strangers. Event-based tracking changes that. Combined with Google’s own sign-in and device-linking data, it lets GA4 stitch more of that activity back into one user journey.
In practice, you will not design your own event schema on day one. GA4 collects a set of events automatically once the tracking tag is installed. It then layers on “enhanced measurement” events, like scrolls, outbound clicks and file downloads, if you leave that toggle on during setup. Google’s own Analytics Help page on enhanced measurement lists them in full.
How An Account, A Property And A Data Stream Fit Together
Three nested containers matter for setup. An account is the top-level container, usually one per business. A property sits inside an account and represents one website or app’s data. A data stream sits inside a property and connects to one specific website, Android app or iOS app. One property can hold more than one data stream, for example when a website and its matching app should share one combined view of the user.
Google’s own Analytics Help documentation caps a single account at 2,000 properties, combining Universal Analytics and GA4 types. Almost no beginner approaches that limit. It exists mainly for large organisations tracking many brands from one login.
What Changes Depending On Your Site Type
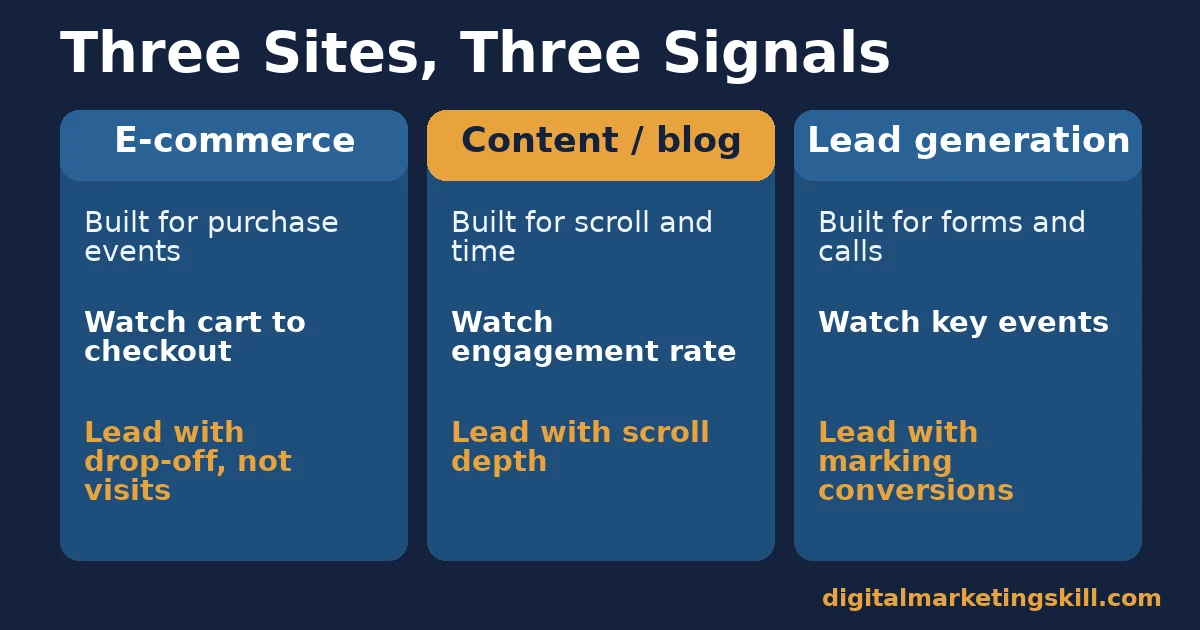
GA4’s defaults work out of the box for every site. But the events worth watching closely are not the same for an online shop, a blog, and a business that lives on form fills and calls. The three profiles below cover most Google Analytics for beginners scenarios. Pick the one closest to your site before you build a single custom report.
E-Commerce Sites: Built For Transaction Events
An online shop’s enhanced measurement already tracks the events that matter most: view_item, add_to_cart, begin_checkout and purchase, each carrying a value parameter. GA4’s e-commerce reporting is built around that chain. So the honest first question for a shop is not “how many visitors?” but “where in that chain do they stop?” The same chain-of-events view helps when mapping a broader sales funnel beyond analytics alone.
Bounce rate matters less here than the checkout funnel. Benchmark research compiled by Lovesdata’s GA4 bounce rate review puts e-commerce bounce rates around 20-45%, lower than most other site types. Shoppers who land on a product page tend to click at least once before deciding.
Content And Blog Sites: Built For Engagement Signals
A blog rarely has one transaction event to anchor on. Its most useful signals are scroll depth, average engagement time and returning visits instead. GA4’s enhanced measurement fires a scroll event automatically the first time a reader passes 90% of a page. That is the closest free proxy to “did they actually read this.” A regular content audit is the natural next step once scroll and engagement data start pointing at specific weak articles.
Content sites also run a structurally higher bounce rate than shops. The same Lovesdata review puts blog and content-site bounce rates as high as 70-90%. A reader who gets their answer from one article has no reason to click to a second page. A high bounce rate alone does not mean a content site is failing.
Lead Generation Sites: Built For Form And Call Events
A services business selling consultations, quotes or bookings usually has no “purchase” event at all. Its conversions are a form submission, a phone click, or a calendar booking. GA4 does not treat any of these as a key event automatically. These sites need at least one custom conversion marked manually in GA4’s admin panel before any report becomes meaningful. That step matters just as much for B2B lead generation sites as for small local service businesses.
Without that manual step, a lead-generation site’s GA4 account can look healthy. Real sessions and real engagement show up, yet conversions stay at zero forever, simply because nothing was ever marked as one.
How To Lead With Each Site Type’s Strongest Signal
Knowing which events matter is only half the job for Google Analytics for beginners. The other half is building your weekly check-in around that one site-specific signal, not a generic traffic number.
E-Commerce Sites: Lead With Checkout Drop-Off, Not Visits
Build a simple funnel report: view_item, add_to_cart, begin_checkout, purchase. Check it weekly for the step with the steepest drop. Fixing that one step, usually the move from cart to checkout, almost always beats chasing more top-of-funnel traffic.
Pair that funnel with a purchase report segmented by device. A shop with a healthy desktop checkout and a collapsing mobile one has a mobile-specific problem. A blended, all-devices number would hide it completely.
Content Sites: Lead With Engagement Rate, Not Bounce Rate
Watch engagement rate instead of bounce rate. GA4 counts a session as engaged when it lasts over 10 seconds, includes a key event, or has two or more pageviews, per Google’s own definition of engagement rate and bounce rate. That is a more honest test of whether an article held attention than a raw bounce figure, which the site type’s naturally high baseline already skews.
Then check which articles trigger the 90% scroll event most often. Study what those posts do differently in their opening two paragraphs. That pattern is usually easier to copy than any generic “write better headlines” advice.
Lead Generation Sites: Lead With Marking Conversions First
Before touching any report, open GA4’s admin panel. Find the form-submission or click event enhanced measurement already recorded, then mark it as a key event, GA4’s current term for a conversion. This single setup step, done once, turns an empty-looking account into a usable one.
Once a key event exists, segment it by the channel that sent the visitor. A lead-generation business often finds that one unglamorous channel, like direct search for its own brand name, converts at several times the rate of a louder paid campaign. The same pattern shows up in search engine optimisation work once branded search is separated from generic terms.
How To Read The Reports That Matter
Five metrics cover almost everything a Google Analytics for beginners checklist needs, regardless of site type. Each is defined below in one sentence, with a note on how to read it, not just what it counts.
Five Metrics Defined In Plain Terms
- Users. The count of distinct people GA4 recognises across a date range, based on a device and browser identifier. Rising users with flat conversions usually means new traffic is lower quality than existing traffic, not that something is broken.
- Sessions. One visit, closed automatically after 30 minutes of inactivity or at midnight, per the session documentation linked above. A user can open several sessions in one day, so sessions always run higher than users.
- Engagement rate. The share of sessions GA4 counts as engaged, over 10 seconds, a key event, or two or more pageviews. It is the closest free number to “did the first screen work.”
- Key events (conversions). Any event you have marked as meaningful, from a purchase to a form fill. Unmarked actions never show up here, the single most common beginner mistake in this guide.
- Average engagement time. How long a page genuinely held focus on a visitor’s screen, not simple time-on-page. Compare it against how long your content takes to read, or your checkout takes to complete.
How To Read These Five Numbers Together
Read them in order, not alone, since that order is the heart of any Google Analytics for beginners workflow. If users are healthy but engagement rate is low, the first screen or landing page is the problem, not the traffic source. If engagement rate is fine but key events stay at zero, check the setup: confirm something is actually marked as a key event. Only once both of those check out is a genuine traffic problem worth debating.
Track changes against your own baseline, not an industry average. A blog with a 60% bounce rate and a shop with a 30% bounce rate can both be healthy for their site type. What matters is whether this month moved against last month, not against a stranger’s benchmark.
The One Rule: Mark A Key Event Before You Trust Any Report
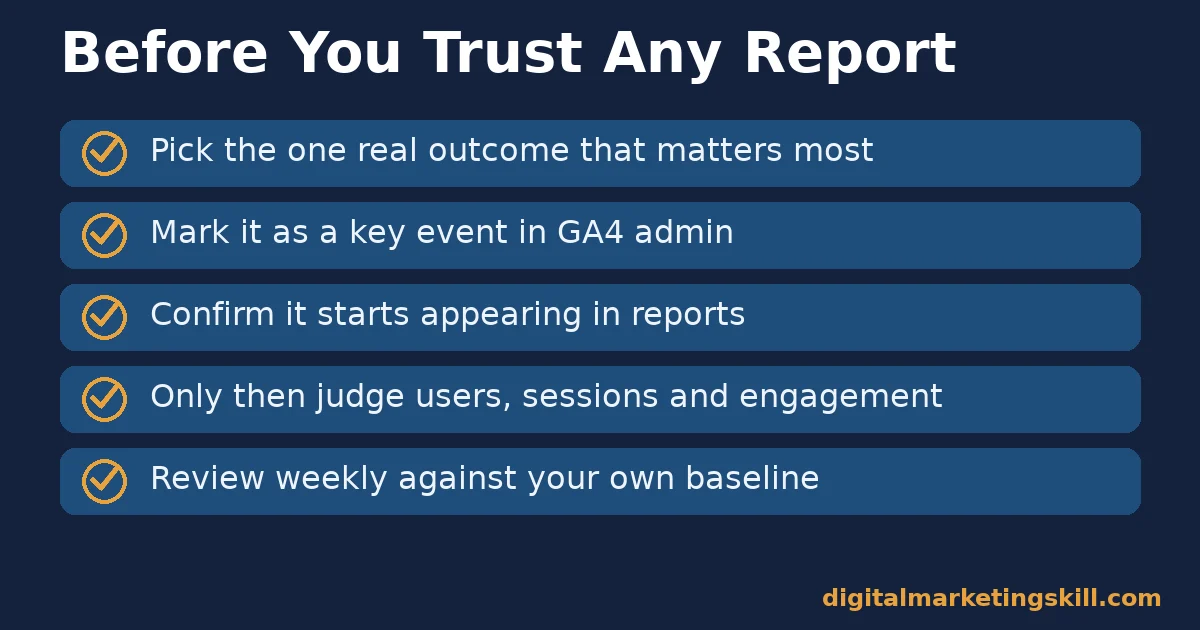
If this Google Analytics for beginners guide leaves you with one rule, make it this one. Do not judge any GA4 report until a real business outcome is marked as a key event. A dashboard full of users, sessions and engagement rate only tells you people showed up. It tells you nothing about whether the site did its job.
Here is an illustrative example, with invented numbers. A small services site installs GA4 and watches sessions climb to 1,800 a month. The owner feels encouraged. Three months later, they mark “quote form submitted” as a key event for the first time. Enhanced measurement had already been collecting that event quietly, so GA4 immediately reports about 40 submissions a month. The owner had no way to see that conversion rate before marking the event, even though visitor behaviour never changed.
The lesson is about sequence, not effort. Traffic work done before conversions are marked is not wasted. But it cannot be judged, because the one number that would prove it worked was never being reported as a key event in the first place.
A Real Case: Why GA4 Replaced Universal Analytics At All
Google’s own explanation for retiring Universal Analytics centres on exactly the event-versus-session gap described above. Universal Analytics’ session-and-pageview model struggled to represent the mix of app and web behaviour that had become normal for most businesses. Google built GA4’s event model as the fix, designed from the start to treat a web visit and an app session as the same kind of data, per the developer documentation on sessions cited earlier.
The limit of this case is clear: it describes Google’s own stated reasoning for the switch, not an independent audit of GA4’s accuracy. Treat it as an explanation for why the tool looks the way it does today, not as proof that GA4 is flawless. The W3Techs figures cited earlier measure adoption, not accuracy, so keep those two kinds of claim separate when you weigh any Google Analytics for beginners advice.
Frequently Asked Questions About Google Analytics for Beginners
Is Google Analytics free to use?
Yes. The standard version of Google Analytics 4 is free for any Google account holder, with no limit tied to the site’s size for most beginners. A separate paid tier exists for very high-traffic enterprise accounts, but almost no beginner needs it.
Do I need to know how to code to use Google Analytics 4?
No. Installing the tag through a website builder, a content management system plugin, or Google Tag Manager usually takes a few minutes with no custom code. Coding only helps later, for advanced custom events most beginners never need.
Do I need a website to create a Google Analytics account?
No. You can create a free account and a property without an existing website. The property stays empty, though, until a real data stream sends it events. It is far more useful once a live site is actually connected.
What is the difference between a session and a user in Google Analytics?
A user is a distinct person GA4 recognises. A session is one visit from that person, closed automatically after 30 minutes of inactivity. One user can produce several sessions in a single day, so sessions are always equal to or greater than users.
Why does my Google Analytics account show visitors but no conversions?
Almost always because no event has been marked as a key event yet. GA4 can collect the raw data, a form submission, a button click, without ever reporting it as a conversion until you tell the property which events count.
How long does Google Analytics keep my data?
GA4 lets you choose a data retention window for user-level and event-level data in the property’s admin settings. Aggregated reports are not subject to that same limit. Check the current setting in your own property rather than assuming a default, since Google has changed defaults before.
Can I learn Google Analytics on my own without a course?
Yes, for the Google Analytics for beginners basics covered here. Google’s own Analytics Help documentation and its free certification programme cover the fundamentals well. Structured, coached practice becomes more useful once you move into multi-channel attribution and custom reporting.
Google Analytics for Beginners: Turn Reports Into Decisions
Google Analytics for beginners stops feeling intimidating once you accept that everything is an event. Pick the one or two signals that match your site type, then mark a real key event before judging anything else. Do that first, and build outward one report at a time.
If you want structured, coached practice putting Google Analytics for beginners into real marketing decisions, Digital Marketing Skill Institute teaches it hands-on inside the Master Diploma in Digital & AI Marketing. The program is built from four AI-powered tracks: AI-Powered Social Media Management and Advertising, AI-Powered Lead Generation and Email Automation, AI-Powered Google Specialist, and AI-Powered WordPress and SEO Specialist. Together they total ten courses, with a Full Stack option for completing all four. It includes unlimited 1-on-1 coaching and mentoring and a U.S. Project Internship with a verified U.S. Work Reference Letter. The diploma is dual US and UK accredited and recognised in more than 100 countries.
The program is 100% online, so you can study and apply these skills from anywhere in your country. Browse more guides on the Digital Marketing Skill Institute blog, read real outcomes on the reviews page, and when you are ready, apply for the Master Diploma or start from the Digital Marketing Skill Institute homepage, wherever in your country you happen to be working from today.
Every figure in this guide was checked against its original source before publication. Figures marked as illustrative are invented examples, not real results.