
Web analytics tools measure what happens on your website: who visits, what they click, where they leave, and whether they buy. Most comparison articles just list ten tools and a feature table. This guide covers the mechanism behind the numbers, how the major categories of web analytics tools differ, and how to pick a stack that matches your budget and your privacy needs.
Key Takeaways
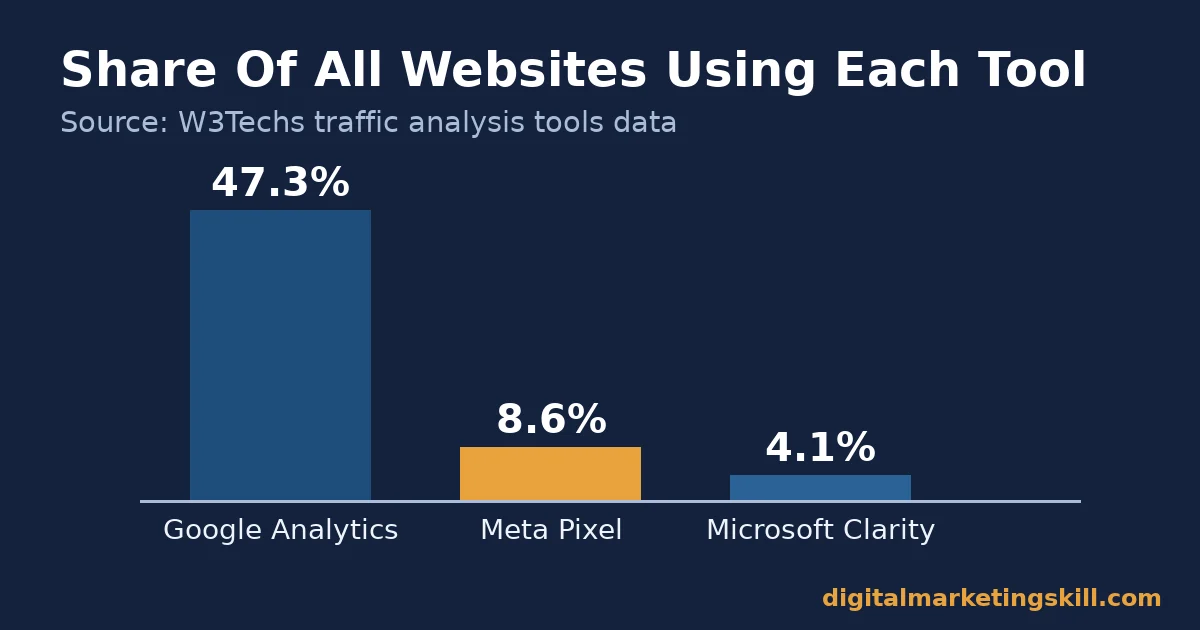
- Google Analytics appears on 47.3% of all websites tracked by W3Techs, giving it 82.6% share among sites that use any traffic analysis tool. Meta Pixel trails at 8.6%, and Microsoft Clarity at 4.1%.
- Microsoft Clarity is free with no traffic limits and used on more than 2 million sites and apps, by its own count. Heatmaps and session recordings no longer force a cost trade-off.
- Matomo is a self-hosted alternative with what it calls 100% data ownership, since the data never leaves your own server. The on-premise edition stays free to download.
- Google defines an engaged session in GA4 as one lasting more than 10 seconds, containing a key event, or including two or more page views. Traffic and engagement measure two different things.
- The right web analytics tools are not the ones with the most features. They answer the specific question your business needs answered, without a new privacy or budget problem.
In this guide
- Most Comparisons Skip The Question You Actually Have
- How Web Analytics Tools Actually Work
- What Differs By Tool Category
- Common Mistakes That Waste A Good Analytics Setup
- Matching Web Analytics Tools To Common Use Cases
- Three Starting Points At A Glance
- Privacy And Consent Are Part Of The Tool Choice
- Choosing Web Analytics Tools By Team Size And Budget
- Measuring Whether Your Analytics Setup Is Working
- The One Decision Rule That Matters Most
- What Doing This Right Looks Like
- Frequently Asked Questions About Web Analytics Tools
- Choosing Your Web Analytics Stack
Most Comparisons Skip The Question You Actually Have
Search for web analytics tools and you get a list of ten logos with short blurbs. Almost none start with the real question. What decision are you trying to make with this data? A founder checking whether a landing page converts needs something different from a team studying where users get stuck inside an app.
Treat the categories below as a framework, not a ranking. Google’s dominance, 47.3% of all websites per W3Techs, reflects that it is free and capable. It does not mean every business needs exactly what it measures. A smaller, specialised tool can still be the better choice.
How Web Analytics Tools Actually Work
Every web analytics tool works the same basic way. A small script runs on each page. It fires when a visitor loads that page, and sends an event to a server: a pageview, a click, a scroll, or a custom action you defined. The tool stores these events. Then it lets you group and count them into sessions, users, conversions and time on page.
The differences start at what counts as a meaningful event. GA4 defines an engaged session as one lasting over 10 seconds, including a key event, or showing two or more page views. A heatmap tool like Microsoft Clarity instead records the raw mouse movement, clicks and scroll depth behind that session. You can watch what the number was hiding. Neither view is complete alone. Traffic counters tell you how many. Behaviour tools tell you why.
This is where most setups quietly fail. A team installs one tool, reads the headline number, and treats it as the full picture. A rising session count with a falling conversion rate is not a contradiction. It is two tools measuring two different things, and you need both to see what actually happened.
What Differs By Tool Category
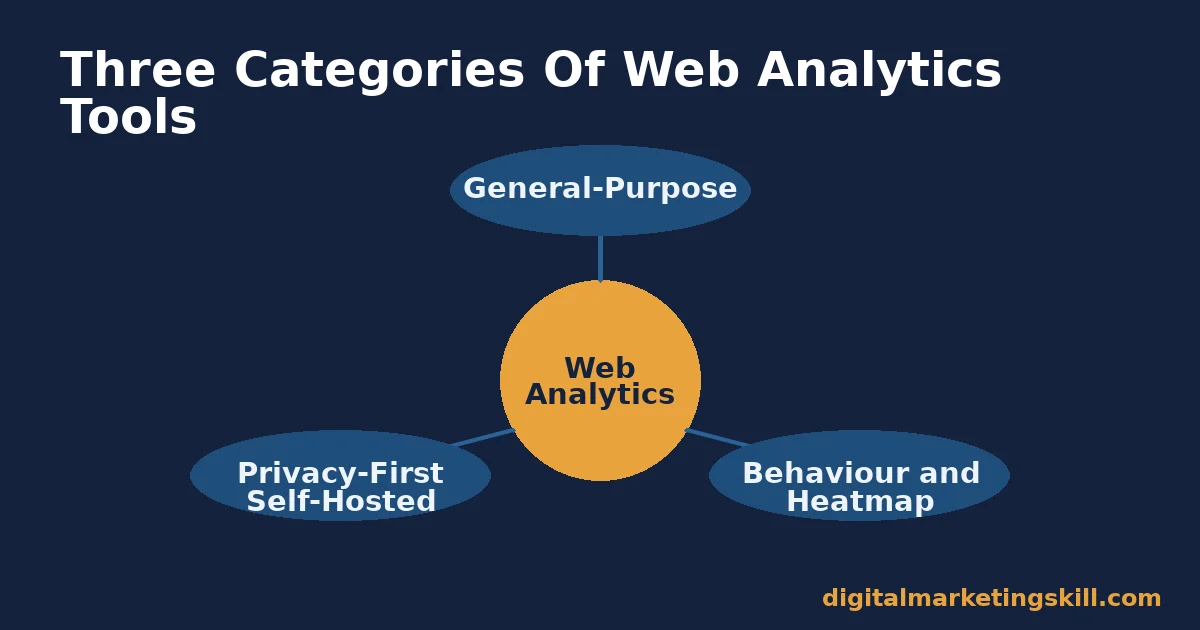
Web analytics tools split into three practical categories: free general-purpose platforms, behaviour and heatmap tools, and privacy-first self-hosted platforms. Each is built for a different job.
General-Purpose Platforms: Built For Breadth
Google Analytics is the default here, used on 47.3% of all websites W3Techs tracks. It covers acquisition, behaviour and conversion in one free tool. That breadth is why it became the default, not necessarily the best fit for every case. The trade-off is depth. GA4’s engaged-session model takes real setup work to configure correctly, and the free tier sends your data through Google’s infrastructure. Google has also fully retired the older Universal Analytics in favour of GA4, so any setup guide built around the old version no longer applies.
Behaviour And Heatmap Tools: Lead With The “Why”
Microsoft Clarity and similar tools record actual sessions: where people click, how far they scroll, where they hesitate. Clarity is free with no traffic limits, used on more than 2 million sites. That removes the old trade-off between session recording and cost. The limitation is scope. A heatmap tool shows what happened on the pages you are watching. It does not replace a full acquisition and conversion report across your whole site.
Privacy-First Self-Hosted Platforms: Lead With Data Ownership
Matomo is the clearest example: an open-source platform you can self-host, so visitor data stays on your own server. Matomo describes this as 100% data ownership, and its on-premise edition remains free to download. The trade-off is operational. Self-hosting means you maintain the server, the updates and the backups yourself. That is a real cost, even with no licence fee attached.
Common Mistakes That Waste A Good Analytics Setup
Most wasted analytics budgets trace back to a handful of repeat mistakes. Knowing them in advance is cheaper than fixing them later.
Installing a tool and never checking it again. A tracking script that nobody reviews is not analytics. It is a line of code. Schedule a recurring review, even if it is short, so the data actually changes a decision.
Running three tools that measure the same thing. Because each platform defines “session” and “engagement” slightly differently, running overlapping tools without reconciling the definitions just produces three different numbers for the same question, which confuses a team instead of informing it.
Treating every metric as equally important. Pageviews feel satisfying to watch, but they rarely drive a decision by themselves. Pick two or three metrics tied to a real business outcome, then let the rest stay in the background.
Skipping the consent and privacy setup. Teams often configure the tracking first and the compliance later, if at all. Since the legal requirement depends on what you collect, not how popular the tool is, this order invites exactly the kind of gap a regulator or a privacy-conscious customer will notice.
Choosing a tool before naming the question. Picking the most popular web analytics tool because it is popular, rather than because it answers your specific question, is how teams end up with a dashboard full of numbers nobody uses.
Matching Web Analytics Tools To Common Use Cases
Because the right stack depends on the question, it helps to see how the categories above map onto a few common situations.
Ecommerce: Lead With Conversion Funnels
An online store cares most about where buyers drop off between browsing and checkout. Start with a general-purpose platform configured to track each step of the funnel as a key event. Add a behaviour tool only on the checkout pages themselves, where a recording can show exactly where hesitation happens, rather than across the whole site.
Content Sites: Lead With Engagement, Not Pageviews
A blog or publisher site often over-indexes on raw pageviews, which rewards clickbait titles over useful content. Track engaged session rate and scroll depth instead, since those numbers better reflect whether a reader actually got value from the page, which matters more for returning traffic and brand trust than a single pageview spike.
SaaS Products: Lead With In-App Behaviour
A software product’s real analytics question usually lives inside the app, not the marketing site: where do new users get stuck during onboarding? Here a behaviour tool pointed at the onboarding flow often matters more than acquisition data, because the acquisition channel did its job the moment the user signed up. What happens after that is the open question.
Three Starting Points At A Glance
Use this as a starting checklist, not a final answer. Your actual choice should still follow the decision rule further down this guide.
- Google Analytics: best first choice for acquisition, behaviour and conversion in one place. Free, used on 47.3% of all websites, but data passes through Google’s infrastructure and GA4’s event model needs real setup time to configure well.
- Microsoft Clarity: best added once you need to see why a specific page underperforms. Free with no traffic limits, used on more than 2 million sites, but it shows behaviour on the pages you are watching, not a full-site acquisition report.
- Matomo: best once data ownership outweighs convenience. Self-hosted and free to download, with data kept on your own server, but you take on the server maintenance a hosted tool would otherwise handle for you.
None of these three is the universally correct choice. Each answers a different question well, and most small businesses eventually use two of the three together rather than committing to just one. The order you add them in matters more than the exact combination, since a second tool only earns its place once the first one has already raised a question it cannot answer alone.
Privacy And Consent Are Part Of The Tool Choice
Which web analytics tools need a cookie consent banner depends on what they collect and where the data goes, not how popular the tool is. Under UK ICO guidance on cookies, only cookies that are strictly necessary to deliver a service the visitor asked for are exempt from consent. Analytics cookies exist for your business intelligence, not the visitor’s request, so they typically need consent before they fire.
A self-hosted platform that keeps data on your own server, and avoids personal data, can sometimes qualify for lighter consent rules. But the exact requirement still depends on your jurisdiction and your configuration, not the brand name on the tool.
So this is not a reason to avoid capable tools. Instead, configure them correctly and document what each one collects before you launch. Do that rather than discovering a compliance gap after a regulator or a customer asks. A short internal document listing each tool, what it collects, and where that data lives takes an afternoon to write and saves far more time than it costs when a question about it eventually comes up.
Choosing Web Analytics Tools By Team Size And Budget
Budget and team size change which trade-off is worth making, even when the underlying categories stay the same.
Solo Founders And Small Teams: Built For Zero Setup Overhead
With no dedicated analytics person, the best web analytics tools are the ones that work well out of the box. A free general-purpose platform plus a free behaviour tool covers almost every question a small team needs answered, without the ongoing maintenance a self-hosted option requires. Resist the urge to add a third tool just because it is free. Every extra script is one more thing nobody has time to check.
Growing Teams: Lead With Defined Ownership
Once a team has someone whose job includes analytics, even part time, the calculation changes. A self-hosted or privacy-first platform becomes realistic, because someone now owns the server maintenance and the configuration work that comes with it. This is also the stage to formally retire overlapping tools, since growing teams are the most likely to have accumulated several scripts nobody has since questioned.
Measuring Whether Your Analytics Setup Is Working
A good web analytics setup is not the one with the most dashboards. It is the one your team actually checks and acts on. Track these:
- Engaged session rate: the share of sessions meeting GA4’s engagement definition, rather than raw session count. A rising engaged rate with flat total sessions usually means content quality improved, not just traffic volume.
- Time to insight: how long it takes someone on your team to answer a specific business question with the data, in minutes, not days. If nobody can answer “did last week’s change help” within an hour, the dashboard is not doing its job.
- Tool overlap: the number of tools collecting the same data redundantly. Three platforms all measuring pageviews wastes setup time and adds consent and compliance risk for no extra insight.
- Action rate: the share of analytics reviews that actually change something. A page edit, a budget shift, a design test, rather than a screenshot nobody acts on.
Read these together. If engaged session rate is flat while traffic grows, the content is not holding attention. If tool overlap is high and action rate is low, you likely have more dashboards than decisions. That is a sign to consolidate, not to add another tool.
None of these four numbers replace the sales and revenue figures you already track. They explain some of the “why” behind a change in those numbers, which a sales dashboard alone usually cannot show you.
The One Decision Rule That Matters Most
Pick your first tool based on the question you need answered this month, not the tool with the most features.
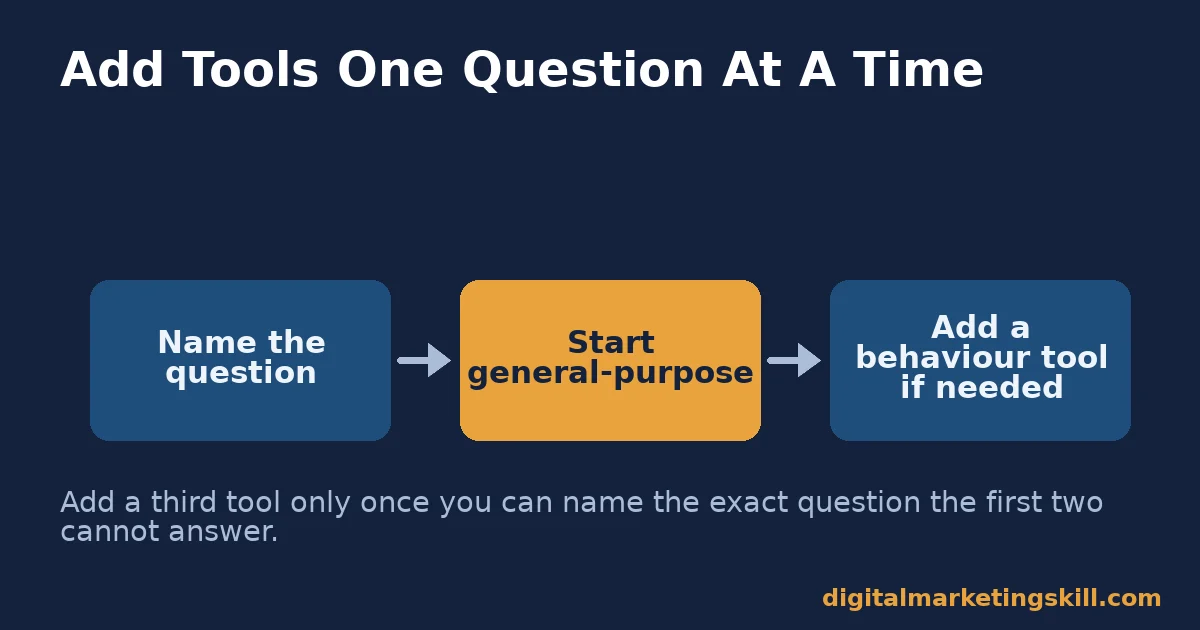
If you need to know where traffic comes from and whether it converts, start with a general-purpose platform. If you need to know why a specific page underperforms, add a behaviour tool for that page alone. Add a third tool only when you can name the exact question the first two cannot answer.
Illustrative, invented numbers: imagine a small store site installs a general-purpose platform. It finds checkout sessions dropping 40% between the cart and payment pages. The traffic tool shows the drop happened, but not why.
A behaviour tool added to the checkout flow shows most visitors scrolling repeatedly near the shipping cost line before leaving. That is a shipping-cost problem, not a traffic problem. The second tool was only needed to answer the question the first one raised, and the fix that follows, showing shipping cost earlier in the flow, has nothing to do with either analytics tool at all.
What Doing This Right Looks Like
DMSI graduate Esther Elueme, as published on the Institute’s reviews page, describes that within a month of starting the course she built a website, posted scheduled ads on social media platforms, and optimised her page for keyword search on Google. Reading a site’s own analytics well enough to know what to optimise next is the skill behind that kind of progress, not just installing a tracking script.
Individual results vary and are not typical for every learner; see the Institute’s earnings disclaimer for the limits of any student outcome shared publicly.
Frequently Asked Questions About Web Analytics Tools
Do I need more than one web analytics tool?
Not at first. Start with one general-purpose platform that covers acquisition, behaviour and conversion. Add a specialised behaviour or heatmap tool only once you have a question the first tool cannot answer, such as why a page underperforms.
Are free web analytics tools reliable enough for a real business?
Yes, for most use cases. Google Analytics and Microsoft Clarity are both free with no meaningful traffic caps, and both power sites far larger than a typical small business. The real limitation is usually setup quality, not the tool’s reliability.
Do web analytics tools require a cookie consent banner?
Often, yes, if the tool stores identifiable visitor data on third-party servers. Some self-hosted or privacy-configured tools can qualify for lighter requirements. Check current guidance for your market, since the rule depends on configuration, not the brand.
What is the difference between a session and an engaged session?
A session is any visit. An engaged session, under GA4’s definition, lasts over 10 seconds, includes a key event, or has two or more page views. Engaged sessions are a better signal of real interest than raw session counts.
Is self-hosted analytics worth the extra setup work?
It depends on your priorities. If data ownership matters more than convenience, a self-hosted platform like Matomo can be worth maintaining. If zero server maintenance matters more, a hosted platform is the simpler choice.
How often should I review my web analytics?
Weekly works well for most small businesses. That is often enough to catch a problem before it compounds across a month, without turning review into a daily distraction from the work the data should inform.
Can web analytics tools track visitors across different countries accurately?
Most tools track visits regardless of where someone is browsing from, anywhere in your country. Accuracy still varies with ad blockers, browser privacy settings and local consent rules that affect whether a tracking script fires at all.
Should I switch web analytics tools if my current one feels limited?
Only once you can name the specific question your current tool cannot answer. Switching tools without a clear reason just resets your historical data and your team’s familiarity with the dashboard, without necessarily solving the actual problem.
What is the single biggest mistake teams make when choosing analytics tools?
Picking a tool for its feature list instead of the question they need answered. A long feature list that nobody uses is worse than a short one that gets checked every week.
Choosing Your Web Analytics Stack
Start with one general-purpose platform. Learn what question it cannot answer for your site. Then add exactly one more tool to answer that specific question. Review the four metrics above monthly, and retire any tool that stops changing what your team does next.
Want to build this skill properly, not just install a script and hope? The Digital Marketing Skill Institute’s Master Diploma in Digital & AI Marketing covers analytics alongside SEO, content and paid media across nine practical courses. It includes unlimited one-on-one coaching and mentoring, plus real project work inside a U.S. company.
The program is dual US and UK accredited and recognised in more than 100 countries, delivered 100% online, so you can learn to read web analytics tools properly wherever you live in your country. Visit digitalmarketingskill.com to explore the curriculum, browse student reviews, or go straight to the application page at digitalmarketingskill.com.
Every figure in this guide was checked against its original source before publication. Figures marked as illustrative are invented examples, not real results.
![9 Amazing Digital Marketing Skills to Make Money Online [With Proof]](https://digitalmarketingskill.com/wp-content/uploads/2019/07/9-Amazing-Digital-Marketing-Skills-to-Make-Money-Online-With-Proof-17.png)






