
Measure content marketing the right way, and three or four numbers tell leadership whether your content is working. Measure it the wrong way, and you end up reporting ten metrics that move together and prove nothing on their own.
This guide shows you exactly which numbers to measure content marketing by at each stage, how to calculate each one, and the single decision rule that keeps a report short enough for anyone to act on.
Key Takeaways
- 60% of the most successful B2B marketers measure content marketing ROI. Only 28% of the least successful do the same, based on a survey of 1,015 B2B marketers (Content Marketing Institute and MarketingProfs).
- Among marketers who track performance well, 80% monitor audience engagement and 63% monitor business impact like leads and pipeline. Both are ahead of brand-authority signals at 38% (CMI/MarketingProfs).
- 96.55% of indexed pages get no organic traffic from Google at all. That means traffic alone is a weak signal unless you also track what that traffic does next (Ahrefs, a study of roughly 14 billion pages).
- Updating and republishing old content lifts organic views by 106% on average. It can double leads from that page, in HubSpot’s own analysis of its blog.
- The average marketing email gets a 35.63% open rate and a 2.62% click rate across billions of sends. A campaign below both numbers has a real, fixable problem (Mailchimp).
In this guide
- Most Metrics Guides Never Say Which Numbers To Report
- How Content Marketing Metrics Actually Prove Value
- What Differs Between Top-Of-Funnel And Bottom-Of-Funnel Metrics
- How To Measure Content Marketing At Each Stage Without Wasting A Report On Noise
- The Scorecard: Six Metrics To Measure Content Marketing, Defined In One Sentence Each
- The One Decision Rule: If A Metric Would Not Change A Decision, Cut It From The Report
- How To Measure Content Marketing By Channel
- Mistakes That Make It Hard To Measure Content Marketing Accurately
- Where Each Content Marketing Metric Actually Comes From
- Frequently Asked Questions About How To Measure Content Marketing
- Turn Your Metrics Into A Content Strategy That Proves Itself
Most Metrics Guides Never Say Which Numbers To Report
Most lists of content marketing metrics give you ten, fifteen, sometimes twenty options. They rarely say which ones to actually put in front of a manager or a client.
That gap matters because every metric costs attention. Report too many, and the one number that explains a budget decision gets buried next to nine that do not.
This guide treats content marketing metrics as a funnel problem, not a list. It walks through what each stage proves and what it cannot prove. It also names which single number to lead with at each stage.
A limit is worth stating up front. Benchmark figures below come from specific platforms and surveys, not every industry or company size. Treat them as a useful reference point, not a universal target for your account.
How Content Marketing Metrics Actually Prove Value
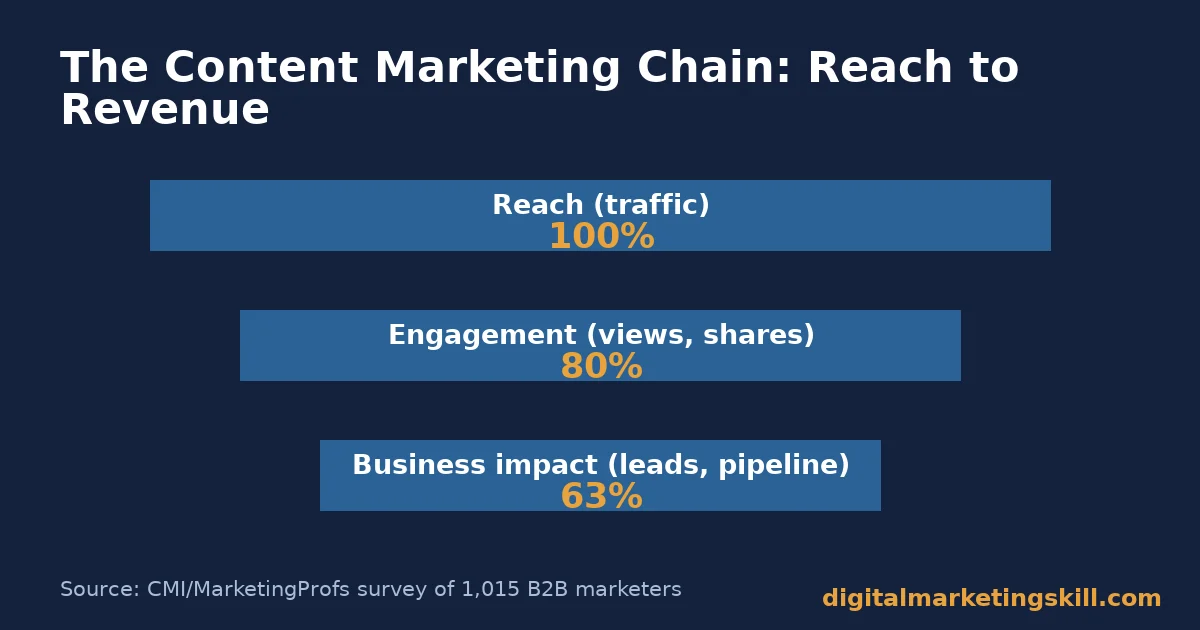
Content marketing works in a chain: reach, then engagement, then a lead, then revenue. Each stage has its own metrics. A strong number at one stage does not guarantee a strong number at the next.
Traffic is the first and weakest signal in that chain. An Ahrefs study of roughly 14 billion pages found that 96.55% get zero monthly organic traffic from Google. Even among pages that do get traffic, most get only a handful of visits.
That is why traffic alone cannot carry a report on how you measure content marketing. A page can rank, get clicks, and still produce nothing. Ranking measures visibility, not whether the right person read it and acted.
Engagement is the second link in the chain. Does the content hold attention and earn a reaction? CMI and MarketingProfs’ survey of 1,015 B2B marketers found that 80% of marketers who report strong content performance track engagement signals. Views, downloads and shares all count toward that number.
Business impact is the third link, and the one leadership actually asks about. Did this content generate a lead, move a deal, or produce revenue? Only 63% of the same effective marketers track that link directly. That is lower than you might expect, given how often it decides budget.
Measuring content marketing well means tracking all three links, but reporting mainly the last one. Reach and engagement explain why a result happened. Business impact is the result leadership is actually asking about.
Most teams get this backwards. They lead a report with traffic because it is the easiest number to pull. Then they spend the rest of the meeting defending why a big traffic number did not translate into revenue.
What Differs Between Top-Of-Funnel And Bottom-Of-Funnel Metrics
Top-Of-Funnel Metrics For Content Marketing: Built For Reach, Not Proof
Top-of-funnel metrics include pageviews, unique visitors, impressions and social reach. They answer one question. How many people were exposed to this content at all?
These numbers are easy to collect and easy to inflate with the wrong traffic. A spike in pageviews from an unrelated viral post tells you almost nothing about whether your content marketing is working.
Use top-of-funnel metrics as a diagnostic, not a headline. A sudden drop tells you something broke. A sudden spike tells you to check the source before you celebrate it.
Bottom-Of-Funnel Metrics For Content Marketing: Built For Business Proof
Bottom-of-funnel metrics include conversion rate, qualified leads, pipeline influence and revenue attributed to content. They answer the question leadership actually cares about. Did this content make the business money or save it money?
These numbers are harder to collect. They require connecting content to a CRM or a sales process, not just an analytics dashboard. That extra setup work is exactly why only 63% of effective marketers track business impact, versus 80% who track simple engagement.
Bottom-of-funnel metrics belong at the top of every report. If a stakeholder only reads one number, make it the one tied to pipeline or revenue, not the one easiest to screenshot.
The gap between those two percentages, 80% against 63%, is really a gap in tooling and habit, not difficulty. Once a content property is wired into a CRM, tracking business impact gets almost as easy as tracking a pageview.
How To Measure Content Marketing At Each Stage Without Wasting A Report On Noise
Top-Of-Funnel: Lead With Traffic Quality, Not Volume
Segment traffic by source before you report a total. Organic search, direct, referral and social each mean something different. A total that blends them hides which channel is actually working.
Pair every traffic number with an engagement number in the same sentence. “12,000 visits, 4.5% of them read past the second screen” tells a stakeholder far more than “12,000 visits” alone.
Refresh and republish your highest-traffic older pages before writing new ones from scratch. HubSpot’s own analysis found that updated posts gained 106% more organic views on average, and in some cases doubled the leads a page produced. None of that required adding a single new URL to maintain.
This is often the fastest way to improve how you measure content marketing without creating more content to measure. A handful of older pages, refreshed with current information and a clearer structure, can outperform several new posts combined.
Bottom-Of-Funnel: Lead With Attribution, Not Vanity
Connect at least one content property, like a form fill or a gated download, to your CRM before you report lead numbers. Without that link, “leads generated” is really just “forms submitted,” which is a weaker claim.
Use a simple attribution model before you build a complex one. Crediting the first piece of content a buyer touched, and the last piece before they converted, catches most of the picture without months of setup.
Report ROI using the actual formula, not a guess. Net profit from content, divided by the cost of producing and promoting it, multiplied by 100. Showing the formula, not just the percentage, makes the number defensible in a budget meeting.
Keep a simple log of which content touched which closed deal, even a basic spreadsheet. Over a quarter, that log becomes the evidence that turns “we think content helps” into a specific, defensible number.
The Scorecard: Six Metrics To Measure Content Marketing, Defined In One Sentence Each
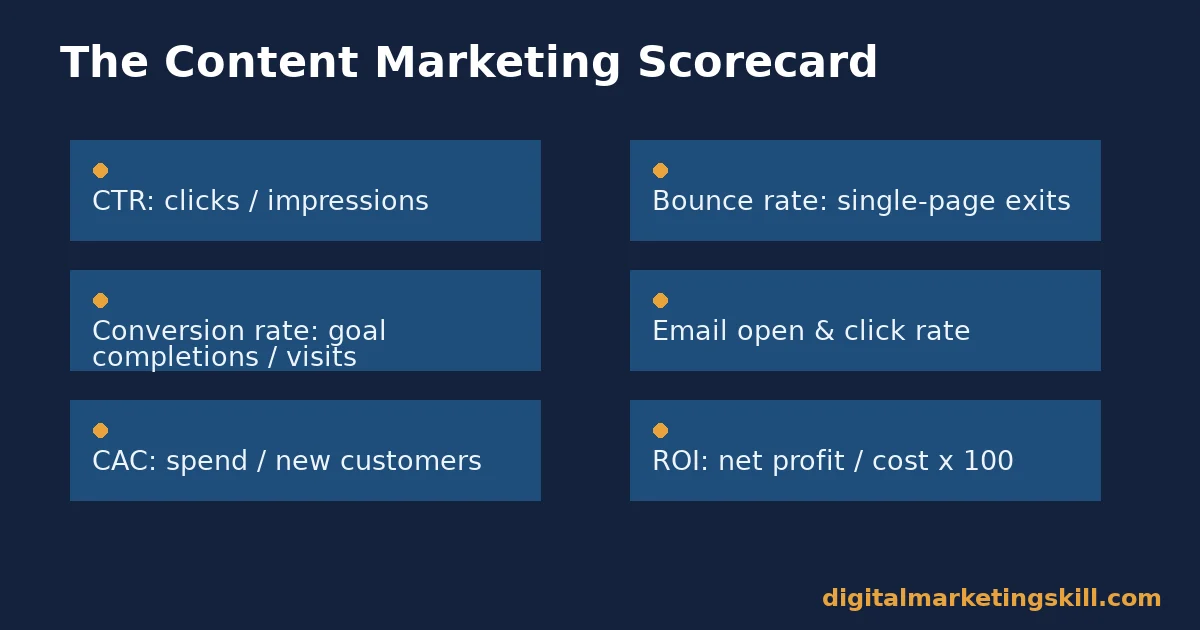
Click-through rate is the share of people who saw a link and clicked it, calculated as clicks divided by impressions. It measures how compelling your headline or call-to-action was, not how good the destination page is.
Bounce rate is the share of visitors who left after viewing only one page. A high bounce rate on a page meant to convert usually points to a mismatch. What the visitor expected did not match what they found.
Conversion rate is the share of visitors who completed a defined goal, like a form fill or a purchase. Always report it next to the traffic number it came from. A high rate on low traffic is a different story than a high rate on high traffic.
Email open rate and click rate measure subject-line appeal and content relevance separately. Mailchimp’s own benchmark data, drawn from billions of sends, puts the average at a 35.63% open rate and a 2.62% click rate. Apple’s privacy changes make open rate somewhat less reliable than it used to be.
Customer acquisition cost, or CAC, is your total content and promotion spend divided by the number of new customers it produced. Track it alongside content ROI, since a channel can have a strong ROI percentage and still carry a CAC that is too high to scale.
Content ROI is net profit from content divided by the cost of producing and promoting it. It is the only metric on this list that directly answers whether content marketing is worth the budget it receives.
The One Decision Rule: If A Metric Would Not Change A Decision, Cut It From The Report
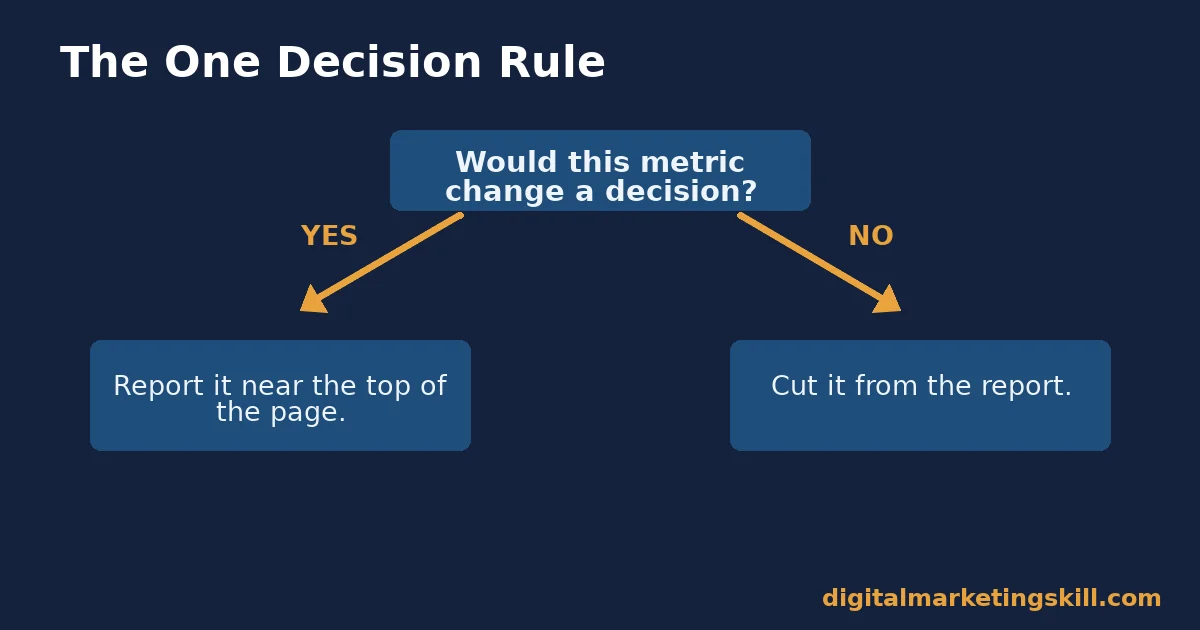
Before you include a metric in a report, ask what decision it would change. If a stakeholder seeing that number would do nothing differently either way, the metric does not belong in that report, even if it looks impressive.
Illustrative, invented numbers: imagine a monthly report with fourteen metrics, where leadership only ever asks about three of them. Cutting the other eleven, and adding one line explaining what changed and why, turns a report nobody reads into one people actually act on.
This rule also protects your own time. Every metric you report regularly is a metric you have to keep collecting, checking and explaining. Cutting the ones nobody acts on frees up real hours for the content work itself.
Apply the same rule before a meeting, not just before a report. If you cannot explain, in one sentence, why a number matters to the person in front of you, leave it off the slide and save it for an appendix.
How To Measure Content Marketing By Channel
Blog and website content is measured mainly through organic traffic, time on page and conversion rate, since the goal is usually to earn attention through search and turn it into an action on your own site.
Email content is measured through open rate, click rate and the conversion rate of whatever the email links to. The three numbers together tell you whether the subject line, the body and the offer each did their job.
Social content is measured through reach, engagement rate and, where it applies, click-throughs back to owned content. Treat social metrics as a reach and relationship signal first, and a direct revenue signal only when you can trace an actual path to a sale.
Video content adds watch time and completion rate to the mix. A view that stops after three seconds proves far less than one that runs to the end. Weight video engagement by completion, not by raw view count alone.
Paid content and sponsored placements are measured through cost per click, cost per lead and the same ROI formula used for organic content, so you can compare a paid channel against an organic one on equal terms.
Whichever channel you measure content marketing through, keep the same scorecard. A channel-specific number only matters once you can connect it back to the engagement and business-impact metrics that apply everywhere.
This is also where a lot of reports quietly go wrong. A team that measures content marketing differently for every channel ends up with numbers that cannot be compared, so nobody can say which channel actually earned the next dollar of budget.
Mistakes That Make It Hard To Measure Content Marketing Accurately
The first mistake is reporting totals without segments. A single traffic number that blends five sources hides which channel is actually driving results and which one is riding on the others.
The second mistake is treating correlation as proof. A content piece published the same month revenue rose is not evidence the content caused it, unless you can trace an actual visitor path from that content to that sale.
Both mistakes share one root cause. You measured content marketing before deciding what each number was supposed to prove. Fix the decision first, then fix the dashboard.
The third mistake is measuring everything equally. Only 33% of B2B marketers say proving ROI is their top content challenge, according to HubSpot’s State of Marketing survey of 1,500-plus marketers. Far more than 33% of teams still track every metric with the same weight, though.
The fourth mistake is ignoring the budget-scrutiny trend. 73% of marketers in that same HubSpot survey say their budgets face more scrutiny than before. That makes a tight, decision-focused report more valuable than a comprehensive one nobody reads in full.
Where Each Content Marketing Metric Actually Comes From
Website traffic, bounce rate and on-site engagement come from an analytics platform like Google Analytics, which defines an engaged session as one lasting more than ten seconds, including a key event, or including two or more page views.
Keyword rankings and competitor visibility come from SEO platforms built for that purpose, which track where your pages sit in search results for the terms you are targeting.
If you only have time to set up one integration this quarter, make it the link between your content and your CRM. Every other way to measure content marketing becomes easier once that single connection exists.
Social shares and reach come from each platform’s own analytics, plus a social-listening tool if you want to see how far content travels past your own followers.
Lead and revenue attribution come from your CRM, connected to your content through form submissions, UTM parameters, or a marketing automation platform that can tie a contact record back to the content that first brought them in.
Frequently Asked Questions About How To Measure Content Marketing
Which content marketing metric matters most?
For most teams, it is a bottom-of-funnel number like qualified leads, pipeline influence, or revenue attributed to content. Top-of-funnel numbers like traffic explain why a result happened, but they rarely answer whether the budget was worth it on their own.
How often should I report content marketing metrics?
Monthly works for most teams, since it gives enough data to see a trend without reacting to daily noise. Pair it with a lighter weekly check of anything urgent, like a sudden traffic or conversion drop.
What is a good conversion rate for content marketing?
It depends heavily on the goal and the traffic source, so treat any single benchmark with caution. A more useful approach is tracking your own rate over time and flagging a meaningful drop rather than chasing an external number.
How do I measure content ROI without a big budget for tools?
Start with free tools: an analytics platform for traffic and engagement, and a spreadsheet connecting your CRM’s lead source field to each content piece. The formula matters more than the tool; net profit divided by cost gets you most of the way.
Should I measure every piece of content the same way?
No. A top-of-funnel blog post should be judged mainly on reach and engagement, while a bottom-of-funnel case study or comparison page should be judged mainly on conversions and leads.
What is the difference between content marketing metrics and SEO metrics?
SEO metrics, like keyword rankings and organic traffic, measure visibility in search engines specifically. Content marketing metrics are broader and include engagement, email performance, social reach and revenue attribution across every channel content touches.
How do I know if my content marketing report is too long?
Apply the decision rule above to every row. If you cannot name the decision a metric would change, cut it, and your report will almost always get shorter and more useful at the same time.
What is the single biggest mistake teams make when they measure content marketing?
Treating every metric as equally important. A report with fourteen untouched metrics is harder to act on than a report with three that leadership actually reads and responds to.
Turn Your Metrics Into A Content Strategy That Proves Itself
Knowing how to measure content marketing is only half the job. Building content that performs well against those metrics from the start is what the Master Diploma in Digital & AI Marketing at Digital Marketing Skill Institute teaches directly.
The program runs four AI-powered tracks: AI-Powered Social Media Management and Advertising, AI-Powered Lead Generation and Email Automation, AI-Powered Google Specialist, and AI-Powered WordPress and SEO Specialist, built from ten courses in total, with a Full Stack option covering all four.
Every track includes a real project and unlimited 1-on-1 coaching and mentoring, so you practise measuring and reporting on real content, not a simulated exercise, from anywhere in your country. The program also includes a U.S. Project Internship with a verified U.S. Work Reference Letter, plus dual US and UK accreditation recognised in more than 100 countries, 100% online.
For related reading, see our guides on measuring brand awareness with eight key metrics, building a content marketing strategy around a repeatable loop, and ten lead generation strategies to grow your pipeline.
Start by cutting your current report down to the metrics that would actually change a decision. Explore the Master Diploma program, read outcomes on the reviews page, or browse the blog for more on proving what your content actually does.
Apply to the Master Diploma program when you are ready to build content that earns its place in the report. Visit Digital Marketing Skill Institute any time, and keep digitalmarketingskill.com bookmarked for the current curriculum and outcomes.
Every figure in this guide was checked against its original source before publication. Figures marked as illustrative are invented examples, not real results.