Brand awareness measures how well people recognize and recall your brand. It matters before anyone decides to buy. The challenge is picking metrics that reflect real memory, not noise. This guide compares recall surveys, share of voice and behavioral proxies. It names the one metric to track first.
Key Takeaways
- Excess share of voice predicts growth. An analysis of 171 ad campaigns spanning three decades found a pattern. A brand’s market share typically grew 0.5% for every 10 points of excess share of voice it held. Nielsen reviewed this work by Binet and Field.
- Recall drives more lift than plain exposure. In a Nielsen analysis of emerging media, brand recall accounted for 38.7% of total brand lift. Baseline awareness came in close behind at 37.5%.
- Format changes recall power sharply. Nielsen’s own norms put aided recall at 81% for branded content. Influencer posts reached 79%, and podcast ads reached 71%.
- Trust metrics move the needle after the ad ends. 97% of US consumers read online reviews before choosing a local business. 49% now trust those reviews as much as a personal recommendation. These figures come from BrightLocal’s Local Consumer Review Survey (US-only).
- A single Net Promoter Score means little without context. The global average is 32 and the median is 44, across more than 150,000 organizations. That is according to SurveyMonkey’s benchmark data. The gap between industries can exceed 40 points.
In this guide
- What Most Brand Awareness Guides Get Wrong
- How Brand Awareness Measurement Actually Works
- Three Ways to Measure Brand Awareness, and What Each One Misses
- How to Fix Each Method’s Blind Spot
- The Brand Awareness KPIs Worth Tracking
- The One Rule for Choosing Your Primary Brand Awareness Metric
- A Real Case: What 171 Ad Campaigns Showed About Brand Awareness and Growth
- Frequently Asked Questions About Brand Awareness
- Start Tracking Brand Awareness With One Metric, Not Ten
What Most Brand Awareness Guides Get Wrong
Most lists of brand awareness metrics stop at naming eight or ten KPIs. They leave you to figure out which one actually matters. That is backwards. Mentions, followers and impressions are easy to pull from a dashboard. But none of them tell you whether a stranger could recall your brand without seeing your logo.
A second problem is treating one number as a universal target. A Net Promoter Score of 40 is strong for software, yet the same score is weak for insurance. Likewise, a 20% unaided recall rate is competitive for a two-year-old challenger brand. By contrast, it would be alarming for a decade-old market leader.
So compare each metric to your own trend, and to named competitors in your category. Do not compare it to a number from an unrelated industry.
A third problem is reporting a number with no direction of travel. A 35% aided recall score sounds the same whether it climbed from 20% or fell from 50%. Always report the current number next to the last one. Name the time gap between the two measurements, so the trend is clear.
This guide treats brand awareness as three separate jobs, not one list: what people remember, how loud you are against competitors, and how people behave when nobody asks them directly. Each job needs its own metric and its own benchmark. For the wider picture beyond awareness, see how to measure content marketing from reach through to revenue.
How Brand Awareness Measurement Actually Works
Every brand awareness metric is a proxy for one of two facts. Can someone retrieve your brand from memory? And does your brand show up often enough to be retrieved at all? Surveys test the first fact directly. Share of voice and behavioral data estimate the second, then infer the first.
Recall surveys ask people to name brands in a category. Unprompted naming is called unaided recall, or top-of-mind awareness. Naming from a list is called aided recall, or recognition. Unaided recall is the harder test. It is also the better predictor of real choice, because it mirrors a shopper standing at a shelf with no brand name in mind.
Share of voice estimates how much of a category’s media space, mentions or ad spend your brand holds against competitors. It does not measure memory directly. It measures the raw material memory is built from: frequency and reach. Nielsen’s review of Binet and Field’s work found a pattern across 171 campaigns. Brands with more voice than market share typically gained share over time. Brands that under-invested typically lost it.
Behavioral proxies capture what people do once a brand is already in their head. These include branded search volume tracked in Search Console, direct site traffic, and review activity. Nobody searches your exact brand name, or types your URL from memory, unless they already recognize it. These signals lag recall by weeks or months. But they are the cheapest signals to track continuously.
Three Ways to Measure Brand Awareness, and What Each One Misses
No single family of metrics replaces the others. A brand that only watches share of voice can look strong on paper while its real recall quietly declines, because voice counts exposure, not comprehension. A brand that only watches branded search can miss slow, broad awareness gains that have not yet turned into search intent. Combine a quarterly recall number with a continuous share-of-voice and branded-search line for a fuller picture.
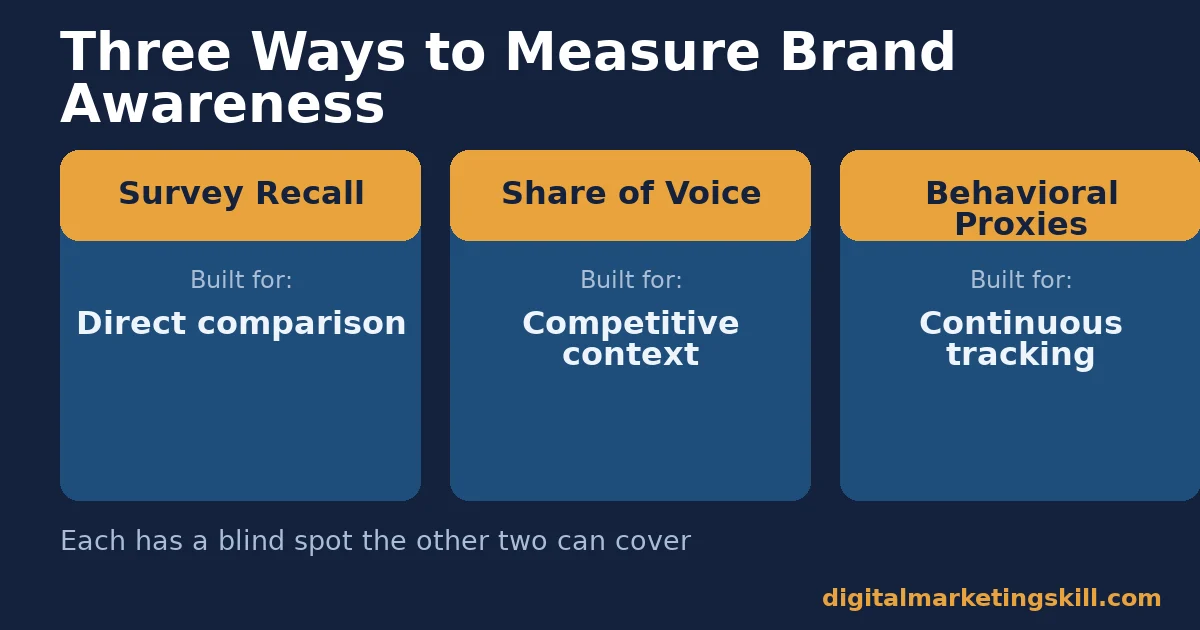
None of the three approaches below is complete alone. Each is built for a different question. Each has a blind spot the other two can cover.
Survey Recall: Built For Direct Comparison
Recall surveys ask the question you actually care about: does a real person remember your brand? A well-run survey asks a sample to name brands unaided, then shows a list for aided recall, then asks about favorability. Unaided recall above roughly 15-20% is a reasonable bar for a newer brand. Established category leaders often clear 40-50%.
The blind spot is cost and speed. A representative panel survey every quarter is expensive. Sample sizes under a few hundred people produce noisy swings that look like trends but are not. As a rough rule, a sample of 300 respondents carries a margin of error near plus or minus 5-6 points. A three-point move between waves is statistical noise, not a real shift.
Before running any survey, write down the exact category and three to five named competitors you are measuring against. A vague category (“marketing software”) produces different numbers than a precise one (“email marketing software for small e-commerce brands”). Comparing results across waves only works if that definition stays fixed.
Share of Voice: Built For Competitive Context
Share of voice turns brand awareness into a relative number: your mentions, ad impressions or search presence, divided by the category total. Because it is relative, it survives category-wide swings in attention. A raw mentions count would be meaningless during those swings; a relative share is not.
The blind spot is that share of voice counts volume, not comprehension. A brand can dominate mentions through negative press or a crisis, and still look strong on this metric, while recall and favorability fall. A steady publishing habit built on a repeatable content marketing strategy tends to grow earned voice more sustainably than one viral spike.
Behavioral Proxies: Built For Continuous Tracking
Branded search volume, direct traffic and review counts update daily or weekly, at close to zero marginal cost. That makes them the best early-warning system between survey waves.
The blind spot is that these proxies mix returning customers with newly aware prospects. A spike in branded search after a price change or a product recall looks identical to a spike from a successful campaign, unless you segment new visitors from returning ones.
How to Fix Each Method’s Blind Spot
Survey Recall: Lead With a Fixed Panel
Instead of a fresh ad-hoc survey each time, recruit a fixed panel of a few hundred category buyers. Re-survey the same panel on a set schedule. A fixed panel removes sampling noise between waves. A five-point move in unaided recall is then more likely to be a real signal than a swing in who answered.
Share of Voice: Lead With Owned, Earned and Paid Apart
Report share of voice in three separate lines: paid media, earned mentions and owned-channel reach. A brand that only gains voice through paid spend has a different growth story than one gaining voice through earned coverage. It also has a different cost structure.
Otherwise, combining all three into one number hides which lever is actually moving. Reviewing the split monthly also shows early when a budget cut would drop paid voice below market share, before earned voice is large enough to compensate.
Behavioral Proxies: Lead With an Isolated Branded-Search Line
Put branded search volume in its own line chart. Filter out spikes tied to known events, such as a price change, an outage or a product recall. What remains is a cleaner proxy for organic recall growth. It is the number worth watching week to week, while the next survey wave is still weeks away.
The Brand Awareness KPIs Worth Tracking
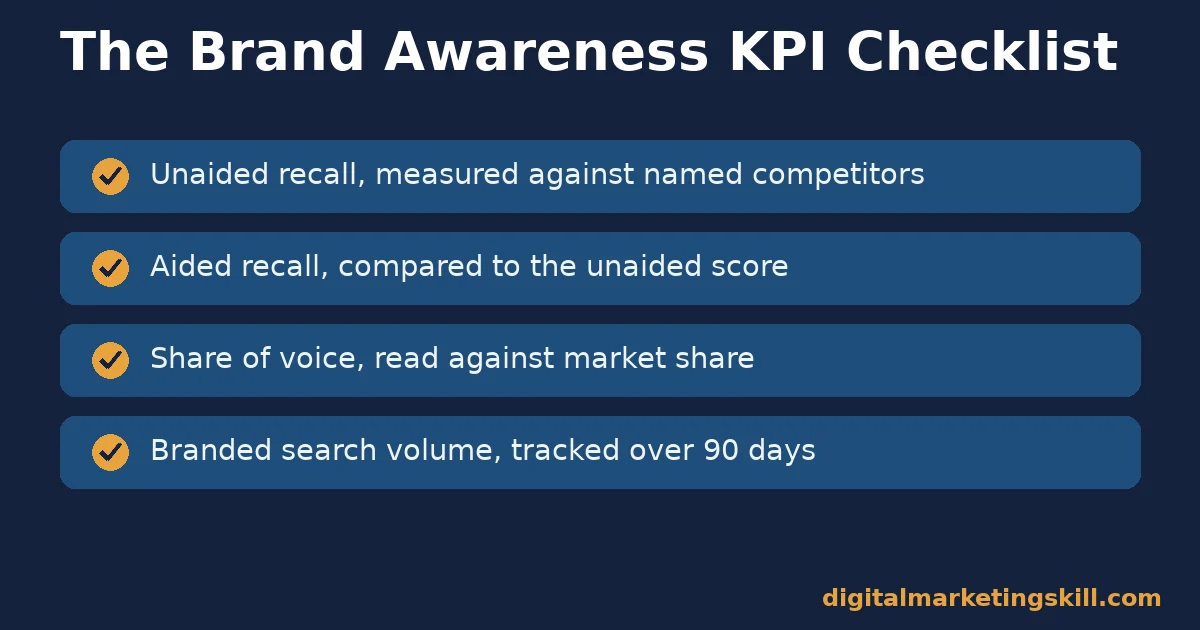
Use this short list, not a long one. Weight the first two most heavily if you must choose. Pair it with ways to increase brand awareness and to use social media for business growth.
- Unaided recall: the percentage who name your brand in your category with no prompt. This is the closest proxy to real shelf or search behavior.
- Aided recall (recognition): the percentage who recognize your brand when shown a list or logo. A large gap against unaided recall means people know your name but do not think of you first.
- Share of voice: your mentions, impressions or ad spend, divided by the category total. Read it against your market share; voice above it predicts growth, voice below it predicts decline.
- Branded search volume: searches for your brand name, isolated from product-category searches. Read the trend over 90 days, not week to week, to avoid noise.
- Direct traffic: visits with no referring link, defined in Google Analytics’ default channel group documentation. A rising share, alongside flat ad spend, signals growing awareness.
- Review volume and rating: the count and star rating of reviews on platforms your buyers check. A rising count with a falling rating signals awareness paired with an experience problem.
- Net Promoter Score: promoters minus detractors, on a 0-10 likelihood-to-recommend question. Benchmark it against your industry median, since the gap between industries can exceed 40 points.
The One Rule for Choosing Your Primary Brand Awareness Metric
Read these KPIs in pairs, not alone. Unaided recall paired with aided recall shows whether you have a naming problem or a priority problem. Share of voice paired with branded search shows whether paid attention is converting into organic curiosity, or disappearing the moment a campaign stops.
If you can track only one metric, choose unaided recall for a brand entering a new market. Choose branded search volume for an established brand defending share in a stable category.
The reasoning is simple. A new entrant has no search history to analyze yet, so a recall survey is the only way to set a baseline. In contrast, an established brand already has years of branded search data sitting free in its analytics tools. Running quarterly surveys on top of that adds cost without adding much signal.
Illustrative, invented example: picture two brands, A and B, spending the same media budget. Brand A is a six-month-old entrant with no branded search baseline. For Brand A, a quarterly 300-person recall survey is the only way to learn whether awareness moved.
Brand B, meanwhile, is a ten-year-old category leader with four years of branded search history. A weekly check of that one isolated line catches a dip from a competitor’s launch faster than a quarterly survey would.
A Real Case: What 171 Ad Campaigns Showed About Brand Awareness and Growth
The clearest documented link between a brand awareness proxy and business results comes from Binet and Field. They analyzed 171 UK ad campaigns run across three decades, and Nielsen later reviewed and summarized the work.
In fact, the underlying campaigns came from the IPA Databank, a long-running collection of effectiveness case studies from agencies and advertisers across many categories. In this analysis, campaigns were grouped by whether a brand’s share of voice sat above or below its existing share of market.
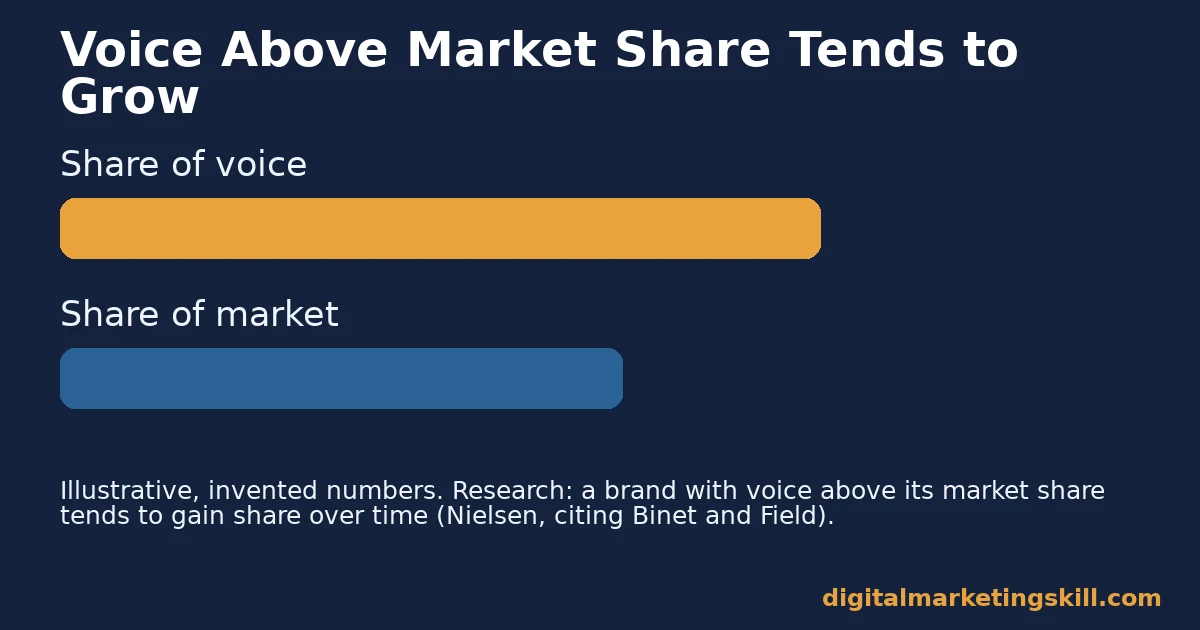
The pattern held across most categories studied. Brands with voice above their market share tended to gain share, at roughly 0.5 percentage points for every 10 points of excess share of voice. Meanwhile, brands with voice below their market share tended to lose share over the same period.
Limits worth stating plainly: this is a correlational analysis of older UK campaigns, not a controlled experiment. It does not isolate share of voice from the quality of the creative running inside that media spend. A brand with a weak campaign but strong voice will not automatically grow at the stated rate. Treat the 0.5%-per-10-points figure as a planning guideline, not a guarantee.
So before cutting a media budget in a slow quarter, check whether that cut would push share of voice below share of market. A short-term saving that drops voice below market share tends to show up later as lost share, which costs more to win back than it saved.
Frequently Asked Questions About Brand Awareness
What is a good brand awareness score?
There is no single good score, because benchmarks vary by category and brand age. A reasonable bar is 15-20% unaided recall for a newer brand, and 40% or higher for an established category leader. Instead, measure against your own category’s named competitors, not a generic target.
How often should you measure brand awareness?
Run recall surveys quarterly or twice a year. Sample-based surveys need time between waves to show a real move, not noise. Track share of voice and branded search weekly or monthly instead, since both update continuously and cheaply.
What is the difference between brand awareness and brand recognition?
Brand awareness is the broader idea: whether people know your brand exists at all. Recognition is the narrower, aided form of it, measured by showing someone your name or logo and asking if they know it. Unaided recall is the stricter test, because it asks someone to produce your name from memory with no prompt.
Can social media followers measure brand awareness?
Followers measure reach among people who already chose to follow you. Indeed, that is a small, self-selected slice of your category. Followers are a weak proxy for awareness among people who have never interacted with your brand, which is the group most campaigns are trying to move.
Does share of voice guarantee market share growth?
No. The 171-campaign analysis behind the 0.5%-per-10-points pattern found a strong statistical association, not a guarantee for any single brand. Creative quality, distribution, pricing and competitor actions all still affect whether extra voice turns into extra share.
What tools can track brand awareness without expensive panels?
Branded search volume is free in most web analytics and search console tools. Likewise, review counts and ratings are visible on the platforms your buyers already check. These two alone give a continuous read between survey waves, even on a limited budget.
Why does aided recall vary so much by content format?
Aided recall tracks how memorable a format is, not just how often it runs. Nielsen’s own norms show branded content and influencer posts producing higher aided recall than podcast ads. That is likely because visual, narrative formats give memory more distinct detail to attach a brand to than audio-only exposure does. Match the format to the recall level you need, not whichever is cheapest to produce.
Start Tracking Brand Awareness With One Metric, Not Ten
Picking the right brand awareness metric matters. So does building the skills to act on what it tells you.
The Digital Marketing Skill Institute’s Master Diploma in Digital & AI Marketing is built from four AI-powered tracks, totaling ten execution-first courses: AI-Powered Social Media Management and Advertising, AI-Powered Lead Generation and Email Automation, AI-Powered Google Specialist, and AI-Powered WordPress and SEO Specialist, with a Full Stack option for learners who complete all four.
Every track includes unlimited one-on-one coaching and mentoring, a U.S. Project Internship with a verified U.S. Work Reference Letter, and dual US and UK accreditation recognised in more than 100 countries. You can apply from anywhere in your country and study 100% online.
The same measurement discipline covered in this guide, picking one primary metric and reading it against a named benchmark, is what the AI-Powered Social Media Management and Advertising track and the AI-Powered Google Specialist track teach you to apply to real campaigns.
Start with the digital marketing blog for more practical guides. Browse real outcomes on the reviews page, or go straight to the Master Diploma program page to see the full curriculum. Wherever you live in your country, you can apply at digitalmarketingskill.com/apply/. Learn more about the institute at https://digitalmarketingskill.com/, or start again any time from https://digitalmarketingskill.com/.
Every figure in this guide was checked against its original source before publication. Figures marked as illustrative are invented examples, not real results.