
E-commerce digital marketing uses online channels, such as search, social media, email, and paid ads, to attract shoppers. It then turns those shoppers into buyers and brings them back for another purchase. Every tactic gets judged by one number: did it lead to a sale.
Key Takeaways
- Global online retail sales are forecast to pass $6.8 trillion a year. That is roughly a fifth of all retail spending worldwide (eMarketer forecast, via Shopify).
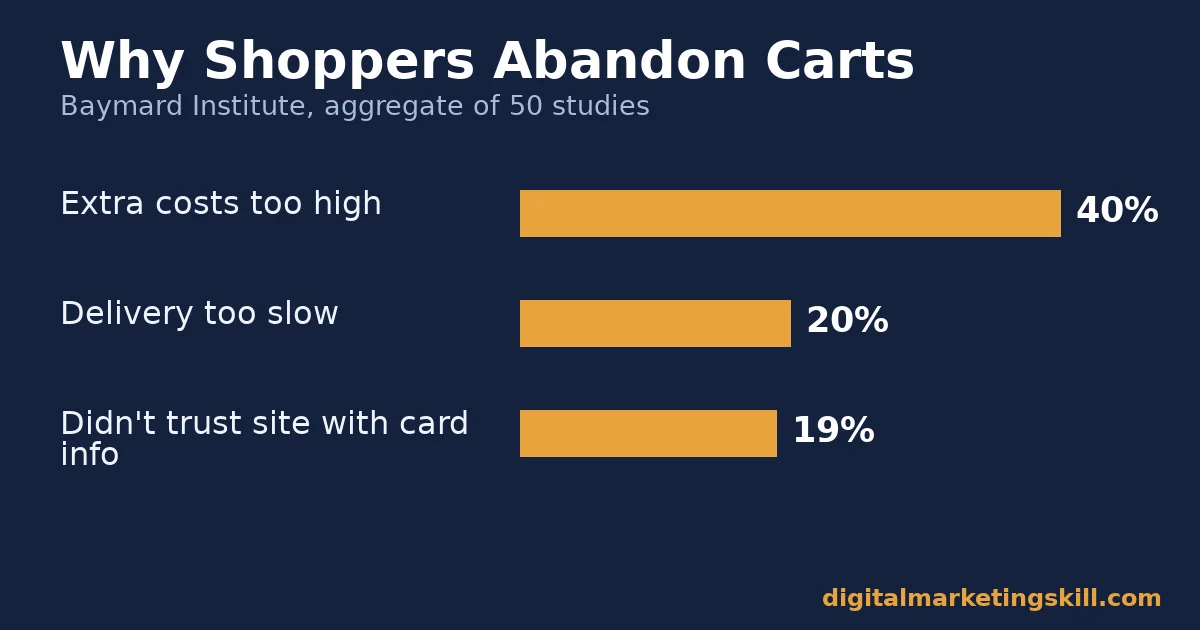
- Shoppers abandon their carts at an average rate of 70.22%, based on 50 studies (Baymard Institute). The top reasons are extra costs, slow delivery, and distrust of the checkout page.
- The average online store converts about 2.72% of visitors into buyers. Mobile runs slightly ahead of desktop (Dynamic Yield benchmark data).
- Email marketing returns an estimated $36 to $42 for every $1 spent. Retail and e-commerce campaigns are among the highest performers (Omnisend industry roundup).
- WooCommerce alone powers close to half of all tracked online stores worldwide (W3Techs). Most e-commerce marketing runs on a small number of shared platforms.
In this guide
- Why Most E-commerce Marketing Plans Underperform
- How E-commerce Digital Marketing Actually Works
- What Differs by Store Stage
- How to Lead At Each Stage
- How to Measure E-commerce Marketing Performance
- The One Decision Rule: Where to Spend the Next Marketing Dollar
- A Real Case: What Changed When One Retailer Fixed Its Checkout
- Frequently Asked Questions About E-commerce Digital Marketing
- Your Next Step in E-commerce Digital Marketing
Why Most E-commerce Marketing Plans Underperform
Most store owners already know the channel list: search, social, email, paid ads, content, affiliates. In fact, the real gap is not knowledge of channels. It is sequencing and measurement.
A new store and a three-year-old store face different problems. Too often, they copy the same generic checklist. A store with no traffic does not need a loyalty program yet. A store with steady traffic but a 70%+ cart abandonment rate does not need another ad channel. It needs a checkout fix.
Here is a common pattern. A founder reads a “10 e-commerce marketing tactics” article and tries all ten at once. As a result, nothing gets enough budget or attention to work. Six months later, the founder concludes that digital marketing “doesn’t work” for their product. In most cases, the tactics were fine. The sequencing was the problem, because each tactic needs enough time and spend to prove itself before you judge it.
This guide treats e-commerce digital marketing as a system with honest limits. The figures below are real and named at the source. But they are averages across many stores and categories. Your category, price point, and audience will move these numbers up or down. Treat every benchmark here as a starting point for comparison, not a guarantee. Done well, e-commerce digital marketing is a system you can measure and improve one stage at a time.
How E-commerce Digital Marketing Actually Works
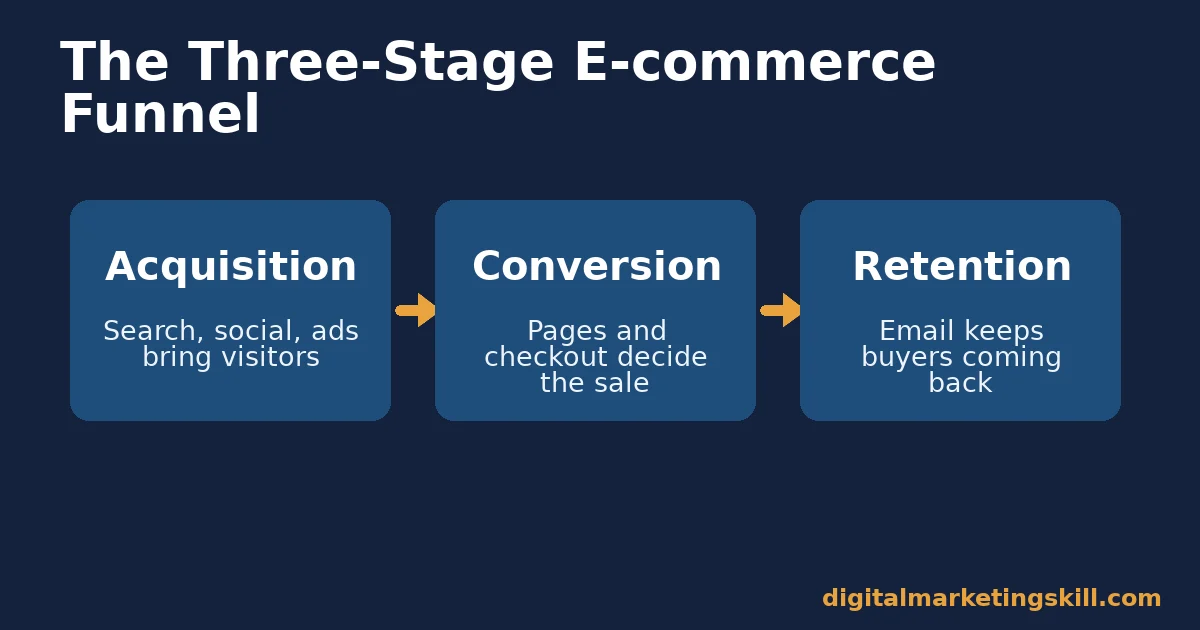
Strip away the jargon. E-commerce digital marketing runs on three linked stages: getting attention, converting that attention into a sale, and keeping the buyer around for another one.
The Three Stages
- Acquisition: search engine optimization (SEO), pay-per-click (PPC) ads, social media, and affiliate or influencer partnerships bring visitors to the store.
- Conversion: product pages, pricing, trust signals, and the checkout flow decide whether that visit becomes a sale.
- Retention: email, SMS, loyalty offers, and remarketing bring buyers back. In practice, a repeat sale is almost always cheaper to earn than a new one.
Why This Breakdown Matters
Google’s own analytics documentation lays this out as a step-by-step funnel. A shopper views a product list, selects an item, views it, adds it to a cart, views the cart, begins checkout, adds shipping and payment details, then purchases. So each step can be tracked and improved on its own. That is why e-commerce digital marketing is more measurable than most other forms of marketing.
Here is the practical upshot. If you only measure total sales, you average away the real problem. A store can have great acquisition and a broken checkout at the same time. The sales number alone will just look “a bit low,” with no clue why.
For example, imagine two stores that each get 10,000 visits a month. Store A has a 3% conversion rate because its acquisition and checkout both work well. Store B also gets 10,000 visits but only converts 1%, because shoppers arrive confused about pricing or stall at checkout. Both stores could report “we did some SEO and ran some ads” and sound identical on a surface-level marketing review. Only a stage-by-stage breakdown shows where Store B is actually losing money.
What Differs by Store Stage
E-commerce digital marketing is not one fixed strategy. The right mix changes with how much traffic and repeat-purchase history a store already has.
New Stores: Built For Finding First Buyers
At first, a new store’s biggest constraint is not conversion rate. It is that almost nobody has found the store yet. At this stage, the job is to earn qualified visits as cheaply as possible. A small amount of traffic should prove the product-market fit is real.
First, search engine optimization and organic social content matter most here. They compound over time. A well-optimized product page or guide keeps earning visits long after it is published. By contrast, a paid ad stops the moment its budget runs out. Affiliate and referral partners can also pay off early, because they only get paid when they produce a result.
A new store should also resist the urge to be everywhere at once. Trying five channels with a small budget usually means none of them get enough spend or attention to show a real result. Two channels, run properly for a few months, teach you more than five channels run for two weeks each.
Scaling Stores: Built For Protecting Margin
A scaling store has already solved the “nobody has heard of us” problem. Its biggest constraint is usually margin. Paid acquisition costs tend to rise as a store scales up its ad spend. Eventually, the same channel mix that worked early on can quietly stop being profitable.
At this stage, the job shifts. Protect and grow customer lifetime value. First, fix the parts of the funnel that leak revenue, such as cart abandonment and weak product pages. Shift spend toward channels with a repeatable, provable return, such as email to an existing list or retargeting shoppers who already showed interest.
A scaling store also tends to have more data to work with, which changes how decisions should get made. Instead of guessing which product photo converts better, the store can test two versions against real traffic and let the data decide. That same data discipline should extend to every channel, not just the ones that are easy to measure.
How to Lead At Each Stage
Knowing what differs by stage only helps if it changes what you do next. Here is the practical fix for each one.
New Stores: Lead With Organic and Owned Channels
- Answer the exact questions buyers ask. For example, product and category pages should cover sizing, materials, and shipping time, not just list features. A buyer who gets a direct answer is far more likely to trust the rest of the page.
- Build an email marketing list from day one. Offer something genuinely useful for an email address. Then follow up with a short welcome sequence, not a single blast.
- Pick a few social channels and post well. Choose the one or two platforms where your real buyers spend time. Then post there consistently instead of spreading thin.
- Test a small, controlled amount of paid traffic. A modest budget on search or social ads shows you which product and message resonate before you scale spend.
- Ask early customers for honest feedback. A short post-purchase survey tells you what nearly stopped someone from buying, which is often more useful than any traffic report.
Scaling Stores: Lead With Retention and Checkout Fixes
- Audit the checkout first. Baymard Institute’s research across 50 studies puts average cart abandonment at 70.22%. It names extra costs (40%), slow delivery (20%), and distrust of the checkout page (19%) as leading causes. Fixing even one of these can recover sales without spending another dollar on ads.
- Segment the email list by behavior. New subscribers, repeat buyers, and cart-abandoners need different messages, not one newsletter.
- Automate the moments that matter. A welcome series, a post-purchase follow-up, and an abandoned-cart reminder run with little daily effort. They consistently beat one-off blasts.
- Shift paid budget toward proven retargeting ads. Showing ads to people who already viewed a product is usually far cheaper per sale than targeting cold audiences.
- Review your paid media mix every quarter. A channel that was profitable a year ago can quietly stop paying for itself as costs rise. Review spend against results on a fixed schedule, not only when something feels wrong.
How to Measure E-commerce Marketing Performance
Each number below answers one question. Track them separately. Averaging them together hides the real problem.
Acquisition and Conversion Metrics
- Conversion rate: the share of visitors who complete a purchase. Dynamic Yield’s rolling benchmark puts the global average near 2.72%. Mobile (2.88%) runs slightly ahead of desktop (2.37%) in its latest dataset. Use it to judge whether your product pages and checkout are doing their job.
- Cart abandonment rate: the share of shoppers who add a product to their cart but leave without buying. The 70.22% average from Baymard Institute is a useful comparison point. What matters more is tracking your own rate over time as you fix checkout friction.
- Customer acquisition cost (CAC): total marketing spend divided by new customers gained. A rising CAC is the clearest early warning that a paid channel is losing efficiency.
- Return on ad spend (ROAS): revenue generated per dollar of ad spend. It is useful for comparing channels against each other. Read it alongside CAC, not instead of it.
Value and Retention Metrics
- Average order value (AOV): the average amount spent per order. Raising AOV through bundles or simple upsell offers can grow revenue without any extra traffic at all.
- Customer lifetime value (CLV): the total revenue a typical customer brings over the whole relationship, not just the first order. A healthy e-commerce business keeps CLV well above CAC, with room to spare for the next sale.
- Email revenue share: the percentage of total revenue that comes from email campaigns and automations. Email can return an estimated $36 to $42 per $1 spent (Omnisend). A low email revenue share on an established list usually means under-investment, not a weak channel.
- Repeat purchase rate: the share of customers who buy more than once. This is the clearest single signal that retention marketing is working.
None of these numbers mean much in isolation. A low conversion rate paired with a healthy CLV might just mean your product has a long consideration window. A high conversion rate paired with a low CLV might mean you are winning cheap, one-time sales that never come back. Read the KPIs together, as a small system, rather than chasing any single metric in isolation.
The One Decision Rule: Where to Spend the Next Marketing Dollar
A store has a limited budget and several competing priorities. Use this rule: fix the leak before you add a channel.
In practice, check cart abandonment and conversion rate before adding a new acquisition channel. A new channel that drives more visitors into a leaky funnel just wastes a larger share of its own spend.
Illustrative, invented numbers: picture a store spending $5,000 a month on ads. It has a 2% conversion rate and a 75% cart abandonment rate. Cutting abandonment to 65% through a simpler checkout, with no extra ad spend, could plausibly lift sales more than adding a new paid channel at the same budget. Every existing visitor becomes more likely to finish checking out. Your own numbers will set the exact lift. Measure the leak before buying more traffic to pour into it.
This same rule applies in reverse. If your checkout is already efficient and conversion sits close to your category’s benchmark, pouring more effort into checkout tweaks will produce smaller and smaller gains. At that point, a new acquisition channel or a retention campaign becomes the better next dollar. The rule is not “checkout always wins.” It is “measure first, then spend where the leak actually is.”
A Real Case: What Changed When One Retailer Fixed Its Checkout
Graham & Brown, a long-running home-furnishings retailer, inherited a difficult checkout. It forced shoppers to choose between signing in, creating an account, or continuing as a guest before anything else. The process was split across several pages with no instant validation, so errors only appeared after a page reload.
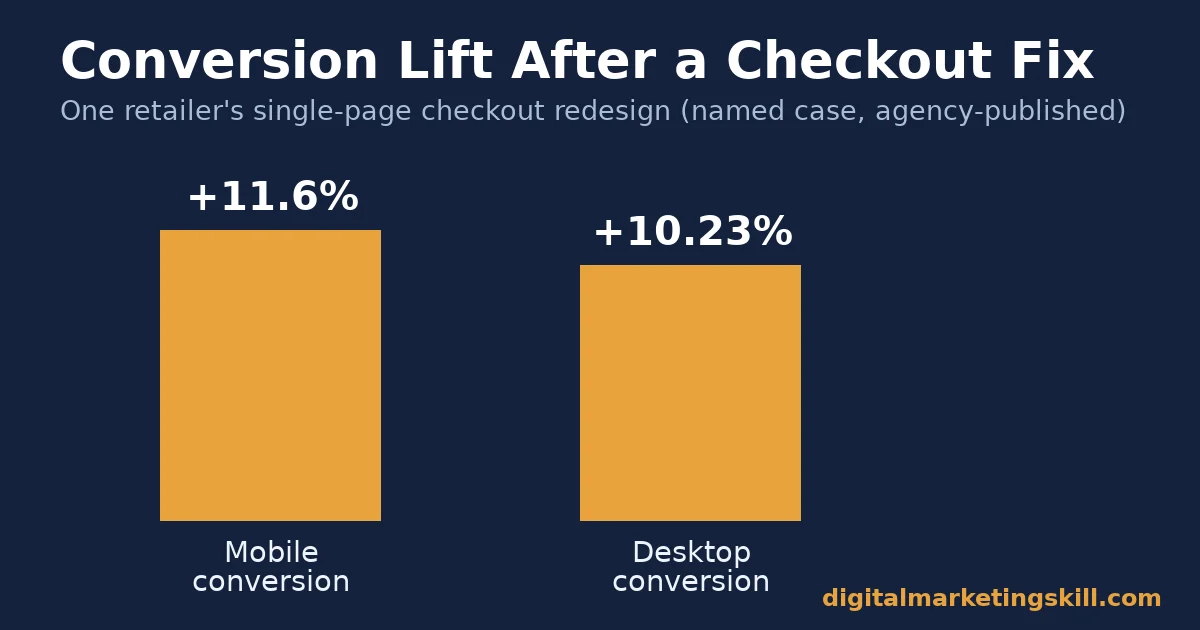
The team rebuilt checkout as a single page with instant validation. Guest checkout became the default. They added an address finder and a visible order summary. According to the case study published by the agency that ran the project, mobile conversion rose 11.6% and desktop conversion rose 10.23%. The project’s cost was reportedly recovered in under two weeks.
The limits worth naming: this is one published case from the agency that did the work. There is no independent audit, no stated sample size, and no detail on whether other changes happened at the same time. Treat it as a strong illustration of what checkout friction costs, not a guaranteed percentage for every store.
The Broader Lesson
Notice how this case lines up with the decision rule above. Graham & Brown did not add a new ad channel first. It fixed the exact friction points that Baymard’s wider research also flags: forced account creation and a slow, multi-page process. The order of operations, not a bigger budget, produced the result.
This is the broader lesson for anyone doing e-commerce digital marketing on a real budget. A single fix to an existing step in the funnel is often cheaper and faster to ship than a brand-new campaign, and it compounds with every visitor who was already arriving at the store. Before approving a new marketing project, it is worth asking a simple question: would this money do more good spent on acquisition, or spent closing a leak that is already costing sales every single day?
Frequently Asked Questions About E-commerce Digital Marketing
What is e-commerce digital marketing in simple terms?
It is the use of digital channels, such as search, social media, email, and paid ads, to help people find an online store, buy from it, and come back again. It is judged on sales and revenue, not just visits or impressions.
How is e-commerce digital marketing different from general digital marketing?
General digital marketing can aim at awareness, leads, or app downloads. E-commerce digital marketing stays sales-focused end to end. Content, ads, and emails all move a shopper toward checking out.
What is the most important channel for a new online store?
No single channel fits every store. But organic search and a store’s own email list tend to be the most durable choices. They keep producing visits and sales without an ongoing ad spend. Paid ads can still help a new store learn faster, as long as the budget stays small enough that a bad week does not sink the business.
How much should a store spend on e-commerce marketing?
There is no universal percentage that fits every business. Budgets vary heavily by category and margin. A more reliable approach: track customer acquisition cost against customer lifetime value. Keep spending only where that ratio stays healthy.
Why do shoppers abandon their carts?
The leading documented reasons, per Baymard Institute, are unexpected extra costs, delivery taking too long, distrust in the checkout page, being forced to create an account, and a checkout that feels too long.
Does email marketing still work for e-commerce?
Yes. Industry estimates put email’s average return at $36 to $42 per $1 spent. Retail and e-commerce sit among the strongest-performing categories, because email reaches people who already showed interest.
Can a small store compete with large retailers on digital marketing?
Yes, especially on content depth, niche targeting, and customer relationships. Large retailers often cannot match the specific, detailed answers a focused store can give its exact audience.
What should I measure first if I only have time for one report a month?
Start with conversion rate next to cart abandonment rate. Together, they show whether your store’s main problem in e-commerce digital marketing is getting visitors or keeping them through checkout, which points straight to the next decision.
Your Next Step in E-commerce Digital Marketing
Getting good at e-commerce digital marketing means treating acquisition, conversion, and retention as three separate skills. Measure each one honestly. Do not hide behind a single sales number.
Want structured, hands-on training instead of piecing this together from blog posts? The Master Diploma in Digital & AI Marketing at Digital Marketing Skill Institute is built around four AI-powered tracks covering ten courses in total. Two tracks apply directly to e-commerce work: AI-Powered Lead Generation and Email Automation, and AI-Powered WordPress and SEO Specialist. Students who want every track can take the Full Stack option. Everyone gets unlimited 1-on-1 coaching and mentoring, plus a U.S. Project Internship with a verified U.S. Work Reference Letter. The program is dual US and UK accredited, recognised in more than 100 countries, and 100% online, so you can study from anywhere in your country.
Explore the full program on the Master Diploma page. Browse more guides on the digital marketing blog. Read real outcomes on the reviews page. Or go straight to the application page when you are ready. Whether you run a store today or want to build one wherever you live, learn more at digitalmarketingskill.com. Support is available to shoppers and marketers anywhere, including anywhere in your country, through digitalmarketingskill.com.
Every figure in this guide was checked against its original source before publication. Figures marked as illustrative are invented examples, not real results.