

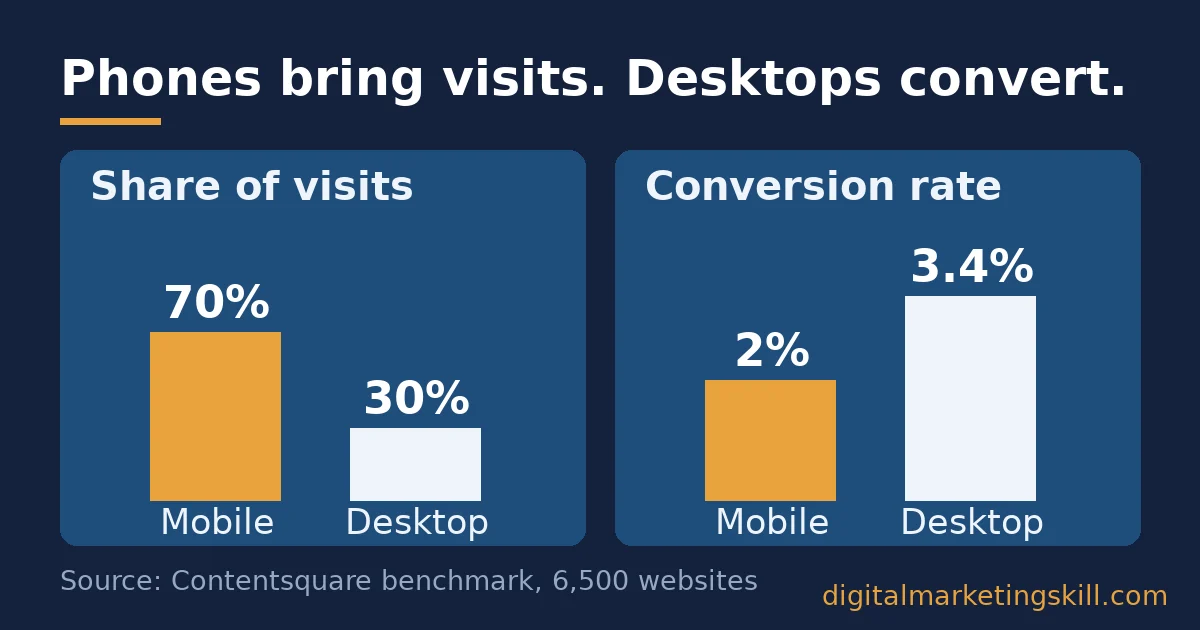
A mobile conversion rate is the share of phone visits that end in a sale, sign-up or lead. Across 6,500 websites, phones bring about 70% of traffic but convert at 2%, while desktop converts at 3.4%. You close that gap by fixing speed, taps, forms and payment, in that order of lost sales.
Key Takeaways
- Phones win the visit but lose the sale. Contentsquare’s benchmark of 99 billion sessions found mobile brings about 70% of traffic, yet desktop converts 75% higher (3.4% against 2%).
- Phones already carry real money. Adobe found that 56.4% of US online holiday spending ran through a smartphone, so a weak mobile checkout costs more than it seems.
- Speed is a direct lever. A Google-commissioned study of 37 brand sites found a 0.1-second faster mobile site lifted retail conversions by 8.4%.
- Payment choice matters on a small screen. In a Stripe holdback test, adding one relevant payment method beyond cards raised conversion by 7.4% on average.
- The best fix is the leak that loses the most orders. Compare each checkout step on mobile with the same step on desktop, then fix the biggest gap first.
In this guide
- What Most Mobile Advice Misses: The Problem Is Not Traffic
- Why Mobile Conversion Rate Trails Desktop: Intent, Friction and Tracking
- Where Mobile Visitors Drop Off: Four Leaks Built Into Small Screens
- How to Raise Mobile Conversion Rate: Fix Each Leak Differently
- Mobile Conversion Rate Varies by Business Model, So Set Your Own Baseline
- How to Measure Mobile Conversion Rate Without Fooling Yourself
- The One Rule Worth Remembering: Fix the Step That Loses the Most Orders
- What Doing This Right Looks Like: Vodafone’s Speed Test
- Frequently Asked Questions About Mobile Conversion Rate
- Your Next Step: Learn to Find and Fix the Leak Yourself
What Most Mobile Advice Misses: The Problem Is Not Traffic
Most mobile marketing guides tell you to get more people onto phones. That advice is out of date, because phones already bring the traffic. DataReportal’s Global Digital Overview counts 5.83 billion unique mobile users, which is 70.4% of the world’s population.
The phone audience is still growing, too. The GSMA, the industry body for mobile operators, reports in its State of Mobile Internet Connectivity research that 4.8 billion people use mobile internet. It also finds that 38% of people live within mobile broadband coverage but do not use it yet. So every leak you fix now pays off on more visits later.
The real gap sits between the visit and the sale. So this guide skips the “go mobile” pitch. Instead, it explains why a phone visit converts less, where each visit leaks, and how to fix each leak in order of the money it loses.
Ground Rules for Reading Mobile Data
Three ground rules keep the advice honest. First, benchmarks are a snapshot, not a permanent ranking, because device habits keep shifting. Second, most device data comes from vendors that sell analytics or payments, so the article names each source and says what it does not show.
Third, some of the gap reflects people who browse on a phone and buy later on a laptop. That is an informed inference, not a settled fact, and it changes how you should read your own numbers.
Digital Marketing Skill Institute checked every figure below against its original source. Where the article uses invented numbers to show a method, it labels them as illustrative.
Why Mobile Conversion Rate Trails Desktop: Intent, Friction and Tracking
A mobile conversion rate falls short of desktop for three linked reasons. Each one needs a different fix, so it helps to separate them before you change anything.
Intent differs. People often use a phone to look, compare and save. Contentsquare’s Digital Experience Benchmark covers 99 billion web and app sessions across 6,500 websites in nine industries. It found that desktop brings under a third of visits but almost 47% of the total time spent on site. Desktop sessions averaged 4 minutes 46 seconds, while mobile sessions averaged 2 minutes 20 seconds.
Friction differs. A phone makes every step harder. Typing takes longer, targets are smaller and networks can be slow. Each extra field or wait gives a distracted visitor a reason to leave.
Tracking differs. When someone browses on a phone and buys on a laptop, many reports credit the laptop. As a result, part of the mobile shortfall is missing credit rather than missing sales. Your analytics setup decides how much of that credit you can see.
Money now follows the phone as well. Adobe’s holiday shopping analysis covers more than one trillion visits to US retail sites. It found that 56.4% of online spending took place on a smartphone. That figure is US-only. Still, it shows that a clumsy mobile checkout is no longer a side issue.
Where Mobile Visitors Drop Off: Four Leaks Built Into Small Screens
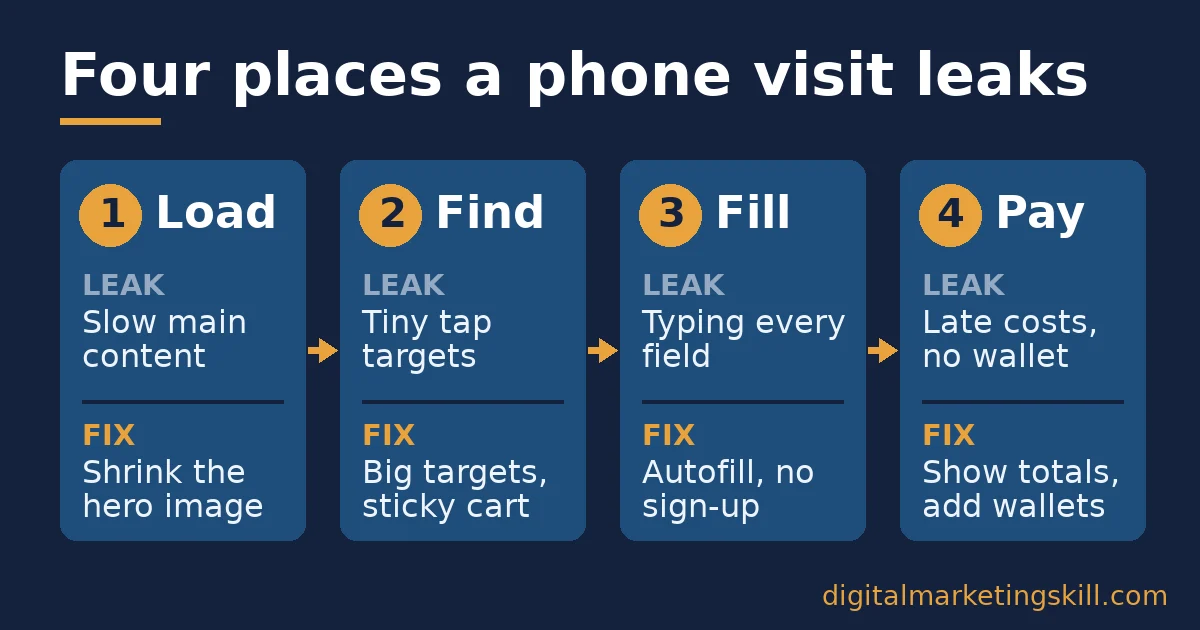
Every phone visit passes four gates before it becomes a sale. The page has to load, the visitor has to find the next step, they have to fill a form, and they have to pay. Each gate leaks in its own way, so each needs its own fix.
Load Speed: The Leak That Starts Before the Page Appears
Phones start with a handicap on speed. The HTTP Archive Web Almanac performance chapter analyses Chrome field data from millions of sites. It found that 48% of sites pass all three Core Web Vitals on mobile, against 56% on desktop. The widest split is responsiveness, where 77% of sites score well on mobile and 97% on desktop.
Core Web Vitals are Google’s three field measures of page experience. They cover how fast the main content appears, how quickly the page reacts to a tap, and how much the layout jumps while it loads.
Navigation: The Leak Where Thumbs Miss Small Targets
A thumb is less precise than a mouse pointer. So small links, tightly packed buttons and menus hidden behind icons all cost taps. The W3C’s WCAG target size rule asks for tap targets of at least 24 by 24 CSS pixels. Links inside a sentence are one of its few exceptions.
Navigation also leaks through missing content. Some sites hide product details, reviews or delivery costs on the mobile layout to save space. As a result, visitors leave to find answers elsewhere, or they switch to a laptop and the phone loses the credit.
Forms: The Leak Where Typing Becomes the Price of Entry
Forms hurt most on a phone because every field means typing on glass. Baymard Institute studies checkout abandonment through surveys of US online shoppers. Its research lists forced account creation (18%) and a long or complicated checkout (17%) among the main reasons people quit. Those figures cover all devices, but a phone makes both problems worse.
Payment: The Leak Where Trust and Wallets Go Missing
The last gate is the most expensive to lose, because the buyer has already decided. In the same Baymard research, extra costs revealed late were the top reason for abandonment at 40%. Meanwhile, a lack of trust in the site with card details was cited by 19%.
Typing a 16-digit card number on a phone adds more friction. That is why digital wallets, which let a buyer pay with a stored card and a fingerprint or face scan, matter more on mobile than on desktop.
How to Raise Mobile Conversion Rate: Fix Each Leak Differently
Each leak above has a matching fix. The four headings below mirror the four leaks, so you can move straight from diagnosis to action.
Load Speed: Lead With the Largest Element on the Page
Start with Largest Contentful Paint, which measures when the biggest image or text block appears. Google commissioned the Milliseconds Make Millions study, which 55 and Deloitte ran across 37 brand sites and more than 30 million mobile sessions. It found that a 0.1-second faster site lifted retail conversions by 8.4% and travel bookings by 10%.
In practice, compress and resize the main image, serve it in a modern format, and stop it waiting behind scripts. Then remove third-party tags that you no longer use. Our guide on how to increase website page speed walks through the main tools step by step.
Navigation: Lead With Thumb-Sized Targets and Visible Answers
Make every main button at least as large as the W3C minimum, and give it space from its neighbours. Next, put the next step within easy reach of the thumb, such as a sticky “Add to cart” bar at the bottom of the screen.
Then show the answers people need to decide. Keep price, delivery cost, returns and reviews on the mobile layout instead of hiding them. Google also uses the mobile version of your pages for indexing and ranking, so the same content helps search too. Our mobile SEO checklist covers that side in detail.
Forms: Lead With Autofill and Guest Checkout
Google’s web.dev guide to payment and address form best practices recommends making guest checkout the default. It also advises the right input types, such as tel for phone numbers, and the right autocomplete values, so the browser can fill fields for the buyer.
After that, cut every field you do not need. For example, use one field for the full name and one for the card number. Each field you remove is one less chance for a thumb to slip.
Payment: Lead With Wallets and Early Total Costs
Show the full price, including delivery, before the payment step. Then add the wallets your buyers already use. Stripe ran a holdback experiment across more than 50 payment methods, where some buyers did not see the new options. Showing at least one relevant method beyond cards raised conversion by 7.4% and revenue by 12% on average.
The same Stripe test found that offering Apple Pay lifted conversion by 22.3% on average. However, Stripe sells these payment tools, and results varied widely by country. So test the wallets that matter in your market rather than copying a single number.
Mobile Conversion Rate Varies by Business Model, So Set Your Own Baseline
A store, a travel site and a lead-generation business do not share one healthy mobile conversion rate. Each asks for a different action, so each leaks at a different point. That is why a single industry average makes a poor target.
The Milliseconds Make Millions study shows how much the effect of one fix can vary. The same 0.1-second speed gain lifted checkout completion by 2.2% on travel sites. Meanwhile, it lifted progress to the form page by 21.6% on lead-generation sites and product-page-to-basket moves by 40.1% on luxury sites.
So set your baseline from your own data. Here is a simple way to do it:
- Online stores: track add-to-cart, checkout start and purchase as separate key events, because most mobile losses happen between cart and payment.
- Lead generation: track form views and form submissions, because a long form on a phone is usually the biggest leak.
- Services and bookings: track taps on call and booking buttons, because many phone visitors would rather call than fill a form.
Once each business type measures its own steps, the mobile conversion rate becomes a tool for decisions instead of a number to worry about.
How to Measure Mobile Conversion Rate Without Fooling Yourself
A single site-wide conversion rate hides the device gap, so split every number by device first. In Google Analytics, a key event is an action that matters to your business, such as a purchase or a form submission. Mark those actions as key events, then add the device category to your reports.
Six Measures to Track by Device
Track these six measures, and read each one against your own desktop figure:
- Mobile conversion rate: key events from phone sessions divided by phone sessions. Read it as a trend over several weeks, not as a daily score.
- Mobile-to-desktop ratio: your mobile rate divided by your desktop rate. On Contentsquare’s averages it is about 0.6, so a ratio well below that points to a mobile problem.
- Step completion by device: the share of visitors who move from one checkout step to the next. It shows where the leak sits, which the overall rate cannot.
- Mobile Largest Contentful Paint: the load time of the main content at the 75th percentile of real visits. Google’s web.dev guidance on Core Web Vitals treats 2.5 seconds or less as good.
- Form error rate: the share of form submissions that fail validation. A high rate on mobile usually means input types or autofill are wrong.
- Revenue per mobile session: mobile revenue divided by mobile sessions. It keeps you honest if a change lifts orders but lowers their value.
Keep these next to the numbers you already track, such as traffic and cost per click. For instance, a paid campaign with cheap mobile clicks can still lose money if revenue per mobile session is low.
The One Rule Worth Remembering: Fix the Step That Loses the Most Orders
This is the most useful point in the guide. Do not start with the step that looks worst in isolation. Instead, start with the step where matching your own desktop rate would recover the most mobile orders.
Decision rule: for each checkout step, recalculate your mobile orders as if that one step converted at your desktop rate. Fix the step that adds the most orders first, then measure, then move to the next.
Worked Example: One Store, Four Steps, One Clear Priority
Here is a worked example with illustrative, invented numbers. A store gets 10,000 mobile sessions a month. On mobile, 60% reach a product page, 25% of those add to cart, 40% of carts start checkout, and one in three checkouts ends in an order. That gives 200 orders, or a 2% mobile conversion rate.
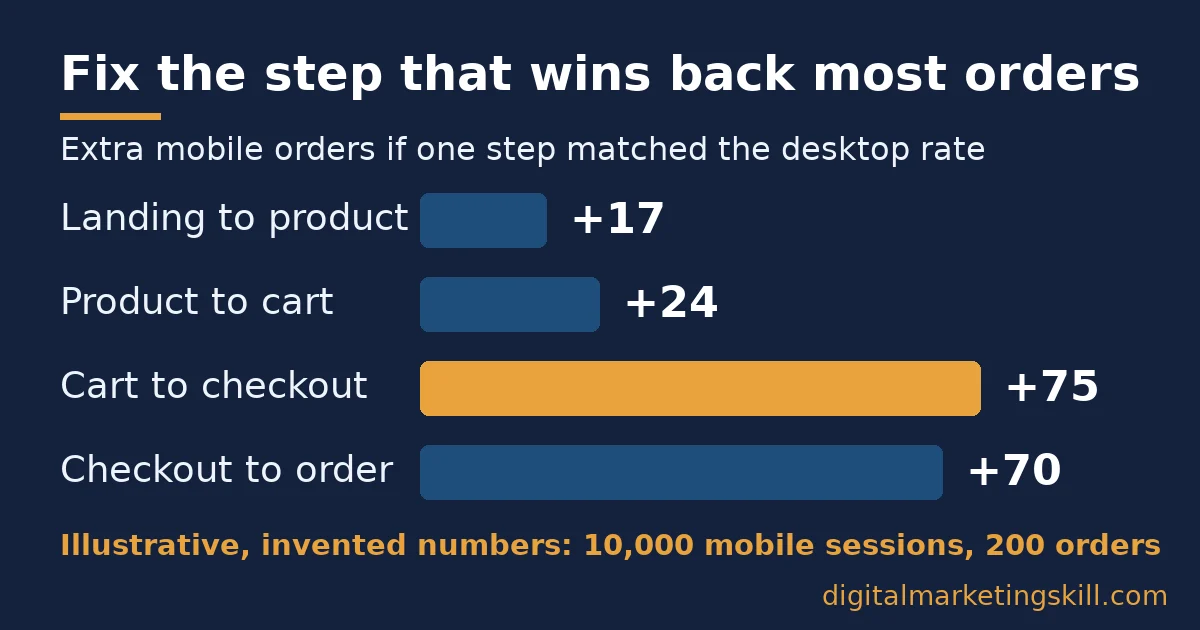
Now compare each step with desktop, where the rates are 65%, 28%, 55% and 45%. Matching desktop on the landing step adds about 17 orders, while the add-to-cart step adds 24. By contrast, the cart-to-checkout step adds 75 orders and the payment step adds 70. So this store should fix the jump from cart to checkout first, even though its landing pages look weaker at first glance.
The rule works because it weighs two things at once: how big the gap is, and how many visitors reach that step. Our guide on increasing website conversion rates covers testing methods you can use once you have picked the step.
What Doing This Right Looks Like: Vodafone’s Speed Test
Vodafone, a telecoms company operating in 21 countries, offers a clean, published example of one fix measured properly. The web.dev Vodafone case study describes an A/B test on a landing page. The team split paid traffic 50/50 between the old version and a faster one. Its only aim was faster loading.
The optimised page improved Largest Contentful Paint by 31%. As a result, it produced 8% more sales, a 15% better lead-to-visit rate and an 11% better cart-to-visit rate.
The test worked because it changed one thing, split traffic evenly and measured sales rather than page scores. Even so, it has limits. It is one company and one page, Vodafone withheld the absolute numbers, and one other speed measure got 15% worse on the new version. So treat it as proof that speed can move sales, not as a promise of 8% for every site.
You can copy the method on a smaller budget. Pick one mobile page with steady traffic, make one change, and split visitors between the old and new versions. Then compare sales or leads per visit, not just speed scores, because sales are what pay for the work.
Frequently Asked Questions About Mobile Conversion Rate
What is a good mobile conversion rate?
Contentsquare’s benchmark of 6,500 websites puts the average mobile conversion rate at 2%, against 3.4% on desktop. Rates vary widely by industry and price point, so your own desktop rate and past trend make better yardsticks than any average.
Why is my mobile conversion rate lower than desktop?
Mobile visitors often browse with lower intent and face more friction from small screens and typing. Some also finish their purchase on a laptop, so your reports credit those sales to desktop.
Does page speed really change sales on mobile?
Yes, controlled tests show a clear link. The Milliseconds Make Millions study found a 0.1-second faster mobile site lifted retail conversions by 8.4%, and Vodafone’s A/B test tied a 31% faster main content load to 8% more sales.
Should I build an app to improve mobile sales?
Most businesses should fix the mobile website first. Every new visitor from search, social or ads lands on the site, while an app only helps people who already know you well enough to install it.
How do I track mobile conversion rate in Google Analytics?
Mark your purchases, sign-ups or form submissions as key events in Google Analytics. Then add the device category dimension to your report and divide phone key events by phone sessions.
How long does it take to see results after a mobile fix?
Give each change at least two to four weeks of normal traffic before you judge it. Compare the result with the same stretch before the change, because daily numbers swing too much to read on their own.
Does a mobile-friendly design guarantee a higher mobile conversion rate?
No, a responsive layout only makes the page fit the screen. You still need fast loading, large tap targets, short forms and familiar payment options before phone visitors buy at a healthy rate.
Your Next Step: Learn to Find and Fix the Leak Yourself
Start small. Pick one checkout step, compare it with desktop, fix it, then measure it for a few weeks before you move on. A steady, measured rise in your mobile conversion rate beats a burst of untested changes. Our overview of what mobile marketing covers is a useful map of the wider channel.
If you want structured practice, the Digital Marketing Skill Institute offers the Master Diploma in Digital & AI Marketing. Its nine practical courses include AI-Powered WordPress Website & eCommerce Development and AI-Powered Google Analytics, which cover the build and measurement skills in this guide. You also get unlimited 1-on-1 coaching and mentoring, plus real project work inside a U.S. company.
The diploma is dual US and UK accredited and recognised in more than 100 countries. It runs 100% online, so you can study from anywhere in your country.
Wherever you live, the skills stay the same, because the same four leaks show up in every market. Apply to the Master Diploma, read more on the Digital Marketing Skill blog, or visit the Digital Marketing Skill Institute homepage to see how the programme works.
Every figure in this guide was checked against its original source before publication. Figures marked as illustrative are invented examples, not real results.
![9 Amazing Digital Marketing Skills to Make Money Online [With Proof]](https://digitalmarketingskill.com/wp-content/uploads/2019/07/9-Amazing-Digital-Marketing-Skills-to-Make-Money-Online-With-Proof-17.png)