
Conversion rate optimization turns more of your existing visitors into leads or customers, without spending more on traffic. Most sites leak conversions at a few predictable points. This guide names those points with sourced data, then shows how to fix them in order.
Key Takeaways
- The median landing page conversion rate is 6.6%, across 41,000 pages and 464 million pageviews (Unbounce).
- Email traffic converts at 19.3%, the highest of any channel measured, far above the overall median (Unbounce).
- A 0.1-second site speed improvement was linked to an average 8% conversion lift for retail sites, across 37 brands and about 30 million sessions (Google).
- Average cart abandonment runs at 70.22%, averaged across 50 studies (Baymard Institute).
- Three-field forms convert at roughly 25%, versus about 21% for five-field forms, across tens of thousands of landing pages (HubSpot).
In this guide
- Why Most Conversion Rate Optimization Advice Falls Short
- How Conversion Rate Optimization Actually Works
- What Differs by the Type of Page You’re Optimizing
- How to Run Conversion Rate Optimization for Each Page Type
- Watching What Visitors Actually Do Before You Test
- Why Page Speed Is a Conversion Rate Optimization Lever, Not Just a Tech Metric
- How to Measure Conversion Rate Optimization Correctly
- A Simple Process for Running a Conversion Rate Optimization Test
- The One Rule for Prioritizing Conversion Rate Optimization Tests
- A Real Case: What a Measured Speed Improvement Looks Like
- How Email Capture Fits Into Conversion Rate Optimization
- Why Conversion Rate Optimization Often Beats Buying More Traffic
- Common Mistakes That Undermine Conversion Rate Optimization
- Frequently Asked Questions About Conversion Rate Optimization
- Conversion Rate Optimization Works the Same Way Wherever You Are
- Turning Conversion Rate Optimization Into a Repeatable Process
Why Most Conversion Rate Optimization Advice Falls Short
Most conversion rate optimization guides jump straight to tactics. Change the button color. Add urgency. Shorten the form. Some of that works, sometimes.
What’s missing is order. A site with a confusing offer and a fast page will still convert badly. A site with a clear offer and a slow page will too. This is an informed framework, not a fixed formula, because conversion behavior shifts by traffic source, device and offer. Treat every benchmark here as a snapshot, not a permanent target.
The real gap is this: conversion rate optimization only works in the right order. Fix the biggest leak first. Smaller fixes come after.
Think about two sites with the same traffic. One tests button colors for a month. The other finds its biggest drop-off stage first, then tests there. Over a quarter, the second site almost always sees a bigger lift. The difference isn’t effort. It’s order.
That ordering problem is the main reason conversion rate optimization programs stall. Teams run test after test, see small or inconsistent results, and conclude that testing “doesn’t work” for their site. Usually, testing was never the problem. Testing the wrong stage was.
How Conversion Rate Optimization Actually Works
Conversion rate is simple math. Conversions divided by visitors, times 100. But the number hides where visitors actually drop off.
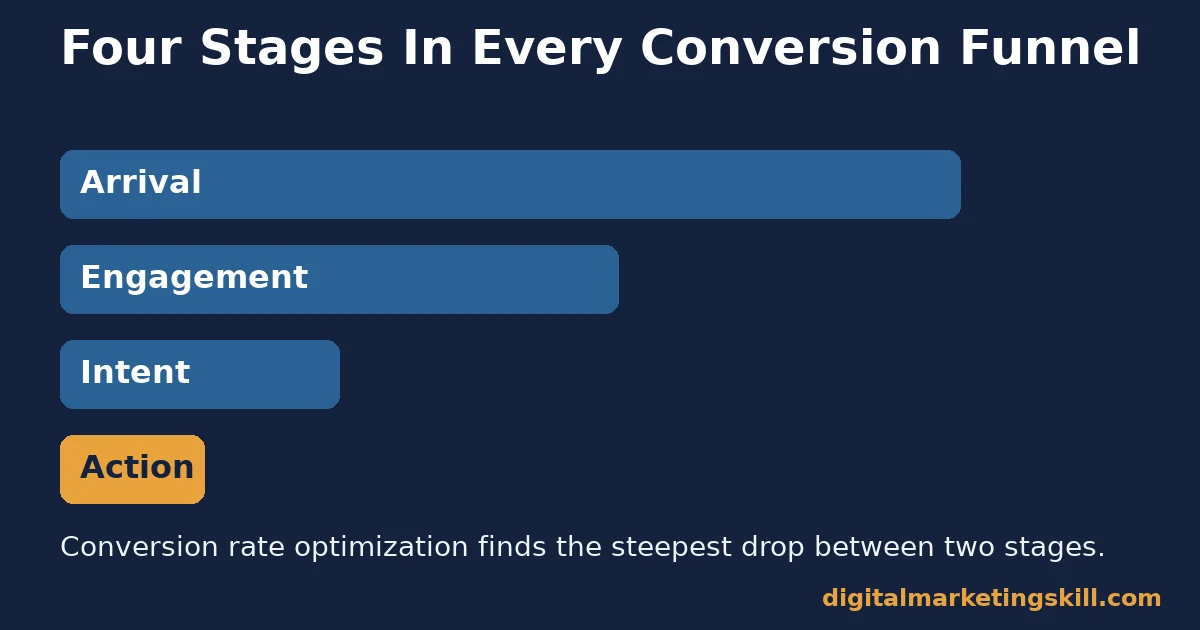
A real funnel has stages: arrival, engagement, intent, and action. A visitor can fail at any stage. Conversion rate optimization means finding the stage with the biggest drop, then testing a fix there first.
Most teams skip this step. They test a headline on a page that’s actually losing visitors to slow load time. The headline test shows no real lift, because the real leak was never on the headline.
Mapping the funnel first also prevents wasted engineering time. A development team can spend weeks building a polished new design for a stage that was never the real problem, while the actual leak sits one stage earlier, unexamined and untouched.
Finding the real leak starts with analytics, not opinion. A web analytics tool that fits your actual traffic volume will show exactly which stage loses the most visitors. That ends the guessing.
This is why Unbounce’s landing page benchmark is useful context, not a target to copy. The median across 41,000 pages is 6.6%, but email traffic alone converts at 19.3%. Traffic source changes the baseline more than most page-level tweaks ever will.
What Differs by the Type of Page You’re Optimizing
Conversion rate optimization isn’t one playbook. A top-of-funnel landing page and a checkout page leak visitors for different reasons.
Landing Pages: Built to Earn a First Click
A landing page’s job is simple. State one offer. Remove distractions. Ask for one action. Most landing page conversion loss comes from unclear value. Too many competing links also pull attention away from the one goal.
Form length matters here more than people expect. HubSpot’s research across tens of thousands of landing pages found three-field forms convert at roughly 25%. Five-field forms convert at about 21%. Every extra field costs real conversions.
Checkout and Cart Pages: Built to Survive Hesitation
Checkout pages face a different problem: last-minute doubt. The Baymard Institute’s meta-analysis of 50 studies puts average cart abandonment at 70.22%. That means roughly seven in ten carts never convert.
Common causes include surprise costs, forced account creation, and a checkout flow that takes too many steps. Removing friction here usually beats adding persuasion.
Trust signals matter more on checkout pages than anywhere else on a site, because this is the moment a visitor commits money. Clear return policies, visible security badges, and transparent pricing all reduce the hesitation that drives the 70.22% abandonment figure higher. None of these fixes require a redesign; most are copy and layout changes a team can test within a week.
How to Run Conversion Rate Optimization for Each Page Type
Once you know which type of page you’re fixing, the test priority changes.
Landing Pages: Lead With Clarity and Form Length
Start by cutting the form to the fewest fields that still qualify a lead. Then sharpen the headline so it states the outcome, not just the feature. Test one change at a time, so you know which one moved the number.
Checkout Pages: Lead With Friction Removal
Show total cost, including shipping, as early as possible. Offer a guest checkout option before asking for an account. Cut the number of steps between cart and confirmation. Each of these targets a specific, documented reason carts get abandoned.
Test these changes in order of visible impact, not order of ease. A guest checkout option is harder to build than a copy change, but it usually removes far more friction, so it earns the earlier test slot.
Watching What Visitors Actually Do Before You Test
Before running any test, watch real behavior. Heatmaps and session recordings show where visitors hesitate, scroll back, or abandon a form mid-field.
This matters because people read far less of a page than most teams assume. The Nielsen Norman Group’s naturalistic study of 25 real users found a hard limit. People have time to read at most about 28% of the words on an average page visit, often closer to 20%. A page packed with text above the real call to action is competing with that limit, not working with it.
If your site handles inbound leads, a focused look at converting more website enquiries into booked conversations is a useful next step. Fix the biggest page-level leaks first.
Why Page Speed Is a Conversion Rate Optimization Lever, Not Just a Tech Metric
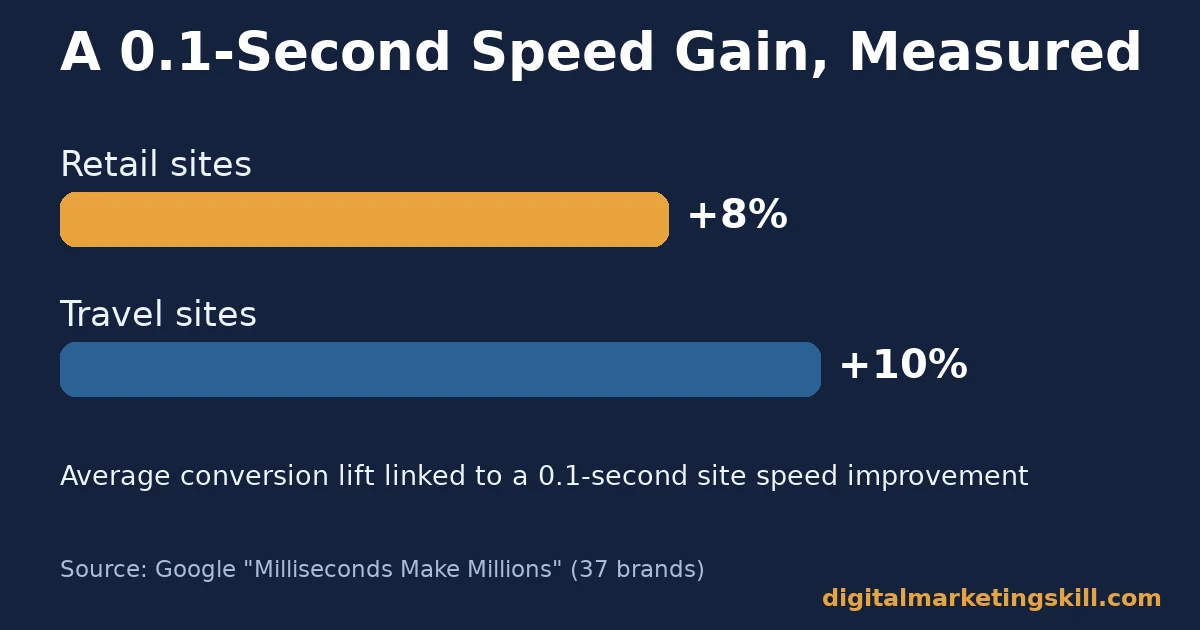
Page speed is one of the few conversion levers with a direct, measured link to revenue. Google’s own research covered 37 brands and about 30 million sessions. A 0.1-second improvement in site speed was linked to an average 8% conversion lift for retail sites, and roughly 10% for travel sites.
Google’s own Core Web Vitals documentation sets concrete thresholds. Largest Contentful Paint should sit under 2.5 seconds. Interaction to Next Paint should sit under 200 milliseconds. Cumulative Layout Shift should sit under 0.1, measured at the 75th percentile of real page loads. A page that fails these thresholds is very likely losing conversions before any copy or design test can help.
Speed problems often compound with traffic problems. If you’re also working on bringing more visitors to the site, fix page speed first. Sending more traffic to a slow page just wastes a larger share of it.
How to Measure Conversion Rate Optimization Correctly
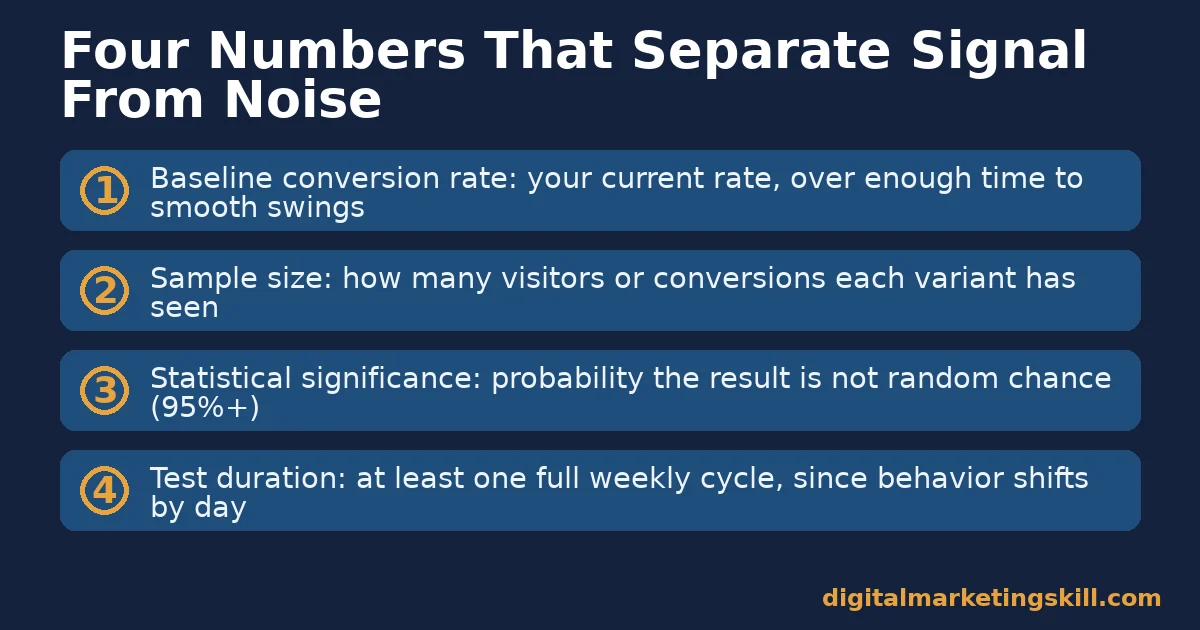
Four numbers separate a real result from a false one.
- Baseline conversion rate: your current rate, measured over enough time to smooth out normal daily and weekly swings.
- Sample size: how many visitors or conversions each test variant has seen. Too few, and the result is noise, not signal.
- Statistical significance: the probability the result isn’t just random chance. Most teams use 95% as a minimum bar before acting.
- Test duration: run tests across at least one full weekly cycle, since behavior often differs by day of week.
Skipping any one of these four numbers is how teams end up acting on noise. A test that “wins” after two days, with a small sample and no significance check, is often just normal daily variation wearing a winner’s label.
Paid traffic adds its own benchmark layer. LocalIQ’s analysis of thousands of advertiser accounts across more than 20 industries puts the average search ad conversion rate at 8.18%, with an average cost per lead of $66.69.
If your paid-traffic conversion rate sits far below that, the issue may be the landing page it sends people to, not the ad itself. Device also matters less than it used to. Dynamic Yield’s rolling ecommerce benchmark puts mobile and desktop conversion rates within about a point of each other. That’s narrower than older benchmarks suggested.
A Simple Process for Running a Conversion Rate Optimization Test
Most failed tests fail for process reasons, not idea reasons. A simple five-step process avoids the common traps.
First, find the stage with the biggest drop-off using analytics. Second, form one specific hypothesis, not a vague idea. Third, change only that one variable in your test. Fourth, calculate the sample size you need for real statistical significance before you start, not after. Fifth, let the test run the full planned duration, even if early results look exciting either way.
Early results are often misleading. A test that looks like a clear winner after two days can flip completely by the end of a full week, especially on sites with lower weekday traffic than weekend traffic, or the reverse for B2B sites.
The One Rule for Prioritizing Conversion Rate Optimization Tests
Decision rule: test the stage with the biggest visitor drop-off first, not the stage that’s easiest to change. A quick button-color test on a healthy stage wastes a testing cycle that a slow checkout page needed.
Illustrative, invented numbers: a site sends 10,000 visitors to a landing page. 4,000 start the form. Only 800 finish it. The real leak is the form, not the headline above it.
Fixing the form first is the higher-value test, even though shortening a headline feels easier. A rough rule of thumb: the stage with the steepest percentage drop usually deserves the next test slot, not the stage a stakeholder happens to dislike the look of, and not the one that simply has the most meeting time behind it.
A Real Case: What a Measured Speed Improvement Looks Like
Google’s “Milliseconds Make Millions” research measured 37 brands across roughly 30 million sessions. A 0.1-second improvement in site speed was linked to an average 8% increase in conversions for retail sites, and about a 10% increase for travel sites.
The limit: this is an aggregate, correlational study across many brands, not a guarantee for any single site. Site speed interacts with traffic source, device mix and page type, so results vary. Still, it’s one of the largest documented links between a measurable technical metric and conversion rate optimization outcomes, which is why speed is worth fixing before most other tests on the list.
How Email Capture Fits Into Conversion Rate Optimization
Email signups are often the first conversion a visitor makes, long before a purchase. Getting this stage right feeds every later stage of the funnel.
The same principles apply here as everywhere else in conversion rate optimization: fewer fields, a clear single offer, and enough traffic to reach real statistical significance before judging a result. A deeper look at what actually moves an email signup conversion rate covers this stage in more depth, including which form placements and incentives tend to perform best.
Why Conversion Rate Optimization Often Beats Buying More Traffic
Buying more traffic scales cost linearly. Every new visitor costs roughly the same as the last one. Conversion rate optimization scales differently. Once a fix is live, it keeps working on every future visitor at no extra cost.
Illustrative, invented numbers: a site gets 10,000 monthly visitors at a 2% conversion rate, producing 200 conversions. Raising that rate to 2.5%, a realistic target for fixing one real leak, produces 250 conversions from the same traffic and the same ad spend. That’s 50 extra conversions a month, every month, without buying a single extra visitor.
This is also why fixing the biggest leak matters more than fixing many small ones. A single fix that moves the rate from 2% to 2.5% beats five small fixes that each move it by a tenth of a point, both in effort and in how easy the result is to verify.
This compounding effect is the real argument for treating conversion rate optimization as an ongoing process, not a one-time project. Each verified fix keeps paying off on every future visitor, long after the test itself has ended.
Common Mistakes That Undermine Conversion Rate Optimization
Three mistakes repeat across teams doing conversion rate optimization without a clear process.
The first is testing the easiest change instead of the biggest leak. The second is ending a test too early, before reaching real statistical significance. A third common mistake is testing multiple changes at once, which makes it impossible to know which change actually caused the result.
Fixing even one of these three usually improves test reliability more than running more tests ever will. Teams that fix their process first tend to need fewer tests overall to reach a meaningful result.
Frequently Asked Questions About Conversion Rate Optimization
What is a good conversion rate optimization benchmark to aim for?
It depends heavily on traffic source and industry. Unbounce’s benchmark puts the median landing page conversion rate at 6.6%, but email traffic alone converts at 19.3%, so the right benchmark depends on where your traffic comes from.
How long should a conversion rate optimization test run?
Long enough to reach real statistical significance and cover at least one full weekly cycle, since visitor behavior often differs by day of week.
Does page speed really affect conversion rate optimization results?
Yes. Google’s own research linked a 0.1-second speed improvement to an average 8% conversion lift for retail sites across 37 brands and about 30 million sessions.
What causes the most cart abandonment?
Surprise costs, forced account creation and long checkout flows are commonly cited causes. The Baymard Institute puts average cart abandonment at 70.22% across 50 studies.
Should I test one change at a time or several together?
One change at a time is more reliable for most teams, because it shows clearly which change caused the result. Testing several changes together needs much larger sample sizes to separate their effects.
Do shorter forms always convert better?
Usually, yes. HubSpot’s research across tens of thousands of landing pages found three-field forms convert at roughly 25%, versus about 21% at five fields, though some qualification fields can still be worth the tradeoff.
What tools are used for conversion rate optimization?
Common tools include analytics platforms for finding drop-off points, A/B testing software for running experiments, and heatmap or session-recording tools for seeing where visitors hesitate.
How many visitors do I need before testing conversion rate optimization changes?
It depends on your current conversion rate and how big a change you expect; lower-traffic sites usually need to test bigger, bolder changes, since subtle changes take too long to reach statistical significance.
Is conversion rate optimization only for ecommerce sites?
No. Any site with a defined action, a form fill, a signup, a booking, a download, can apply conversion rate optimization. The stages and metrics are the same; only the specific action being measured changes.
Can small sites with low traffic still do conversion rate optimization?
Yes, but statistical significance takes longer to reach with less traffic. Small sites often get more value from fixing obvious, documented leaks (slow pages, long forms, hidden costs) than from running formal A/B tests that would need months of data to read reliably.
Conversion Rate Optimization Works the Same Way Wherever You Are
The mechanics in this guide don’t change by country. Funnels, baselines and statistical significance work the same way whether your visitors are local or global.
What changes is the benchmark itself. A good conversion rate anywhere in your country still depends on your traffic source, device mix and offer, not a single worldwide number.
The process matters more than the location: find the biggest leak, test one change, measure it properly, then move to the next stage. Currency, payment methods and local trust signals can shift checkout-page results, but the underlying funnel logic stays the same no matter where your visitors browse from.
Turning Conversion Rate Optimization Into a Repeatable Process
In short: conversion rate optimization isn’t a list of tricks. It’s a repeatable process of finding the biggest leak, fixing it, and measuring the result properly before moving on, then repeating the same process on the next-biggest leak.
If you want structured help building the skills behind conversion rate optimization, email automation and landing page strategy, the Digital Marketing Skill Institute’s Master Diploma in Digital & AI Marketing is built around four AI-powered tracks: AI-Powered Social Media Management and Advertising, AI-Powered Lead Generation and Email Automation, AI-Powered Google Specialist, and AI-Powered WordPress and SEO Specialist.
That’s ten courses in total, with a Full Stack option for completing all four. The program includes unlimited 1-on-1 coaching and mentoring, plus a U.S. Project Internship with a verified U.S. Work Reference Letter. It’s dual US and UK accredited and recognised in more than 100 countries, 100% online, so you can study wherever you live.
No results are guaranteed by any course, tool or technique described here. See our earnings disclaimer for details.
Explore the Master Diploma program, browse more guides on the digital marketing blog, read student reviews, or apply to get started from anywhere in your country. Learn more at digitalmarketingskill.com, and visit digitalmarketingskill.com again to see the full curriculum.
Every figure in this guide was checked against its original source before publication. Figures marked as illustrative are invented examples, not real results.
![9 Amazing Digital Marketing Skills to Make Money Online [With Proof]](https://digitalmarketingskill.com/wp-content/uploads/2019/07/9-Amazing-Digital-Marketing-Skills-to-Make-Money-Online-With-Proof-17.png)






