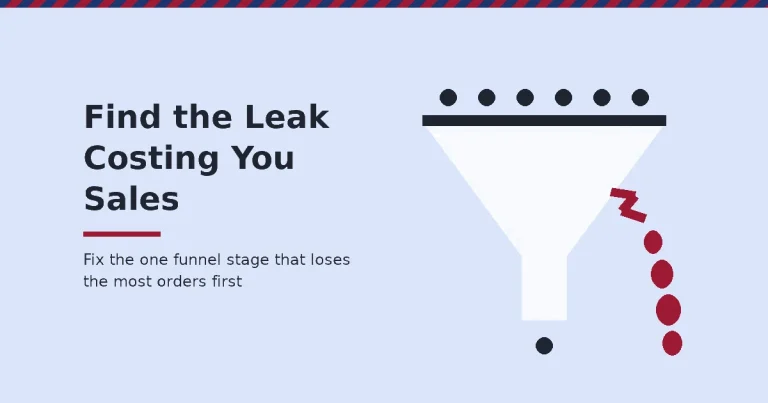
A sales funnel maps how a stranger becomes a paying customer, stage by stage. Most funnels leak badly at one specific point, not evenly throughout. Find that one leak. Back it with real conversion data, and you fix more revenue than any new traffic campaign could add.
Key Takeaways
- The median landing page converts visitors at 6.6%, across a dataset of 41,000 pages and 464 million pageviews (Unbounce).
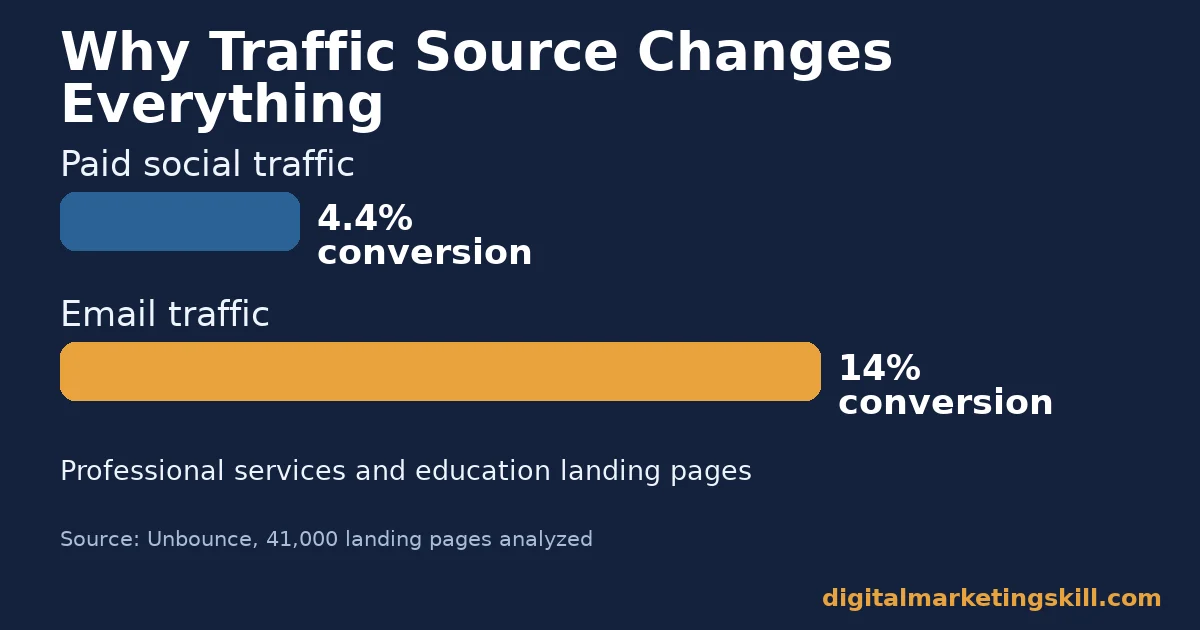
- Email traffic converts at roughly 14% in professional services and education. That is far above paid social’s 4.4% in the same study (Unbounce).
- Average online cart abandonment sits at 70.22%, a figure built from 50 separate studies (Baymard Institute).
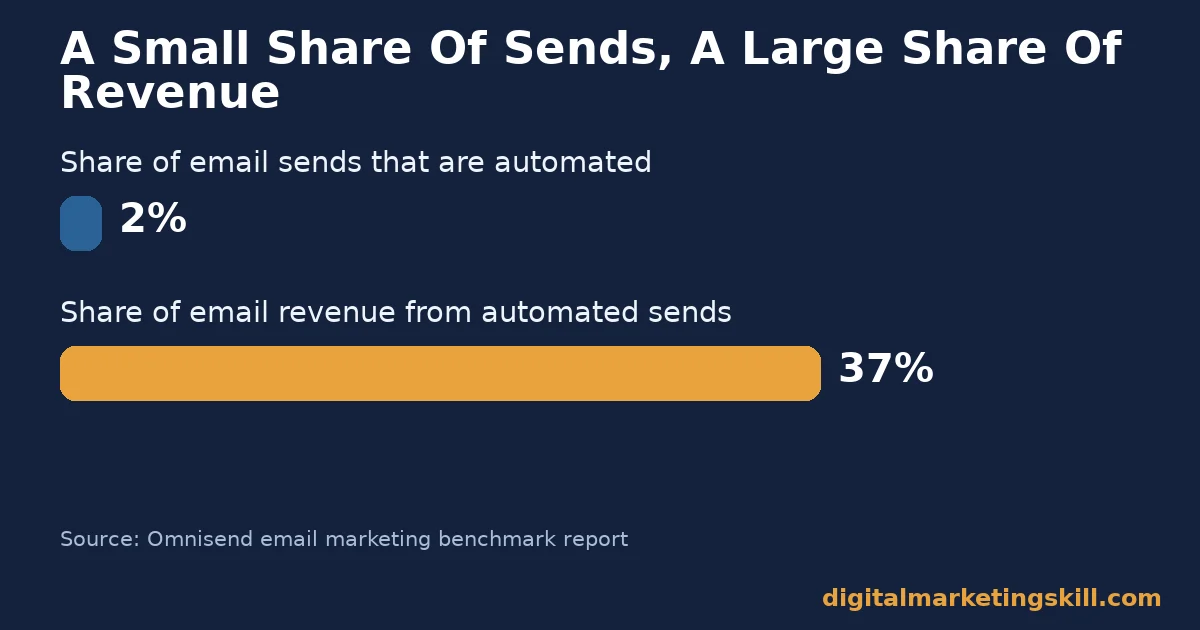
- Automated emails make up only 2% of sends but drive 37% of all email-generated sales (Omnisend).
- Search ad accounts convert at 8.18% on average, with cost per lead around $66.69 across 20+ industries (LocalIQ).
In this guide
- Where Most Sales Funnel Guides Go Wrong
- Why The Sales Funnel Model Still Works
- What Differs By Sales Funnel Stage
- How To Actually Fix Each Sales Funnel Stage
- How To Measure Your Own Sales Funnel
- The One Decision Rule: Fix The Narrowest Stage First
- A Real Case: Fixing One Funnel Stage, Not The Whole Funnel
- Frequently Asked Questions About The Sales Funnel
- Where To Learn This Properly
Where Most Sales Funnel Guides Go Wrong
Most sales funnel explainers stop at a diagram: awareness, interest, decision, action. They rarely show what a real leak looks like. Few attach real numbers to any of it. That gap makes the concept feel academic instead of useful.
Ask most marketers where their funnel leaks, and you get a guess, not an answer. That guess is usually wrong, because the stage that feels broken and the stage that is actually broken are rarely the same one. Replacing that guess with a measured number is the entire point of this guide.
Instead, this guide treats the sales funnel as a measurement tool first, a diagram second. Every stage below comes with a benchmark you can compare your own numbers against, so you can see exactly where your own funnel differs from the broader market.
This is an informed reading of current public data, not a fixed rule for every business. Your own funnel will vary by niche, price point, and traffic source.
One more ground rule: a sales funnel only works if you actually measure it. Otherwise, a diagram on a slide changes nothing on its own. In fact, the value comes entirely from comparing your real numbers against it, stage by stage.
Why The Sales Funnel Model Still Works
A sales funnel works because it forces one question at every stage. What percentage of people move forward from here? Without that framing, marketing effort spreads evenly across a process that rarely leaks evenly.
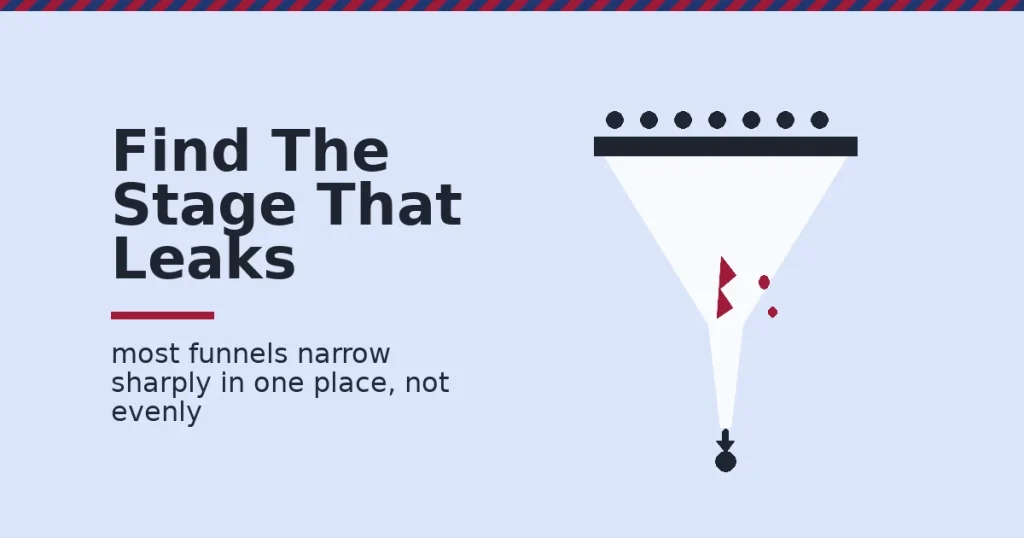
Most sales funnels narrow sharply at one point. For example, a business might get strong traffic and a strong close rate. Yet it can still underperform, because the middle stage quietly loses most of the people who reach it. The funnel shape exists specifically to expose where that narrowing happens.
Once you can see the leak, you can test a fix against it. That, in short, is the entire value of the model. It turns a vague feeling of “sales are slow” into one specific, measurable stage to improve.
Compare this to guessing. Without a funnel view, a business often fixes the stage that feels most visible, such as the homepage design, rather than the stage that actually loses the most people. More often than not, the two are not the same stage at all.
This is also why a sales funnel view tends to pay for itself quickly. Instead of spreading a limited budget across every part of the journey, you spend it on the one change most likely to move the final number.
What Differs By Sales Funnel Stage
A sales funnel has three practical stages. Each one is built for a different job. Treat them as separate problems, not one big problem.
Awareness: Built For Reach
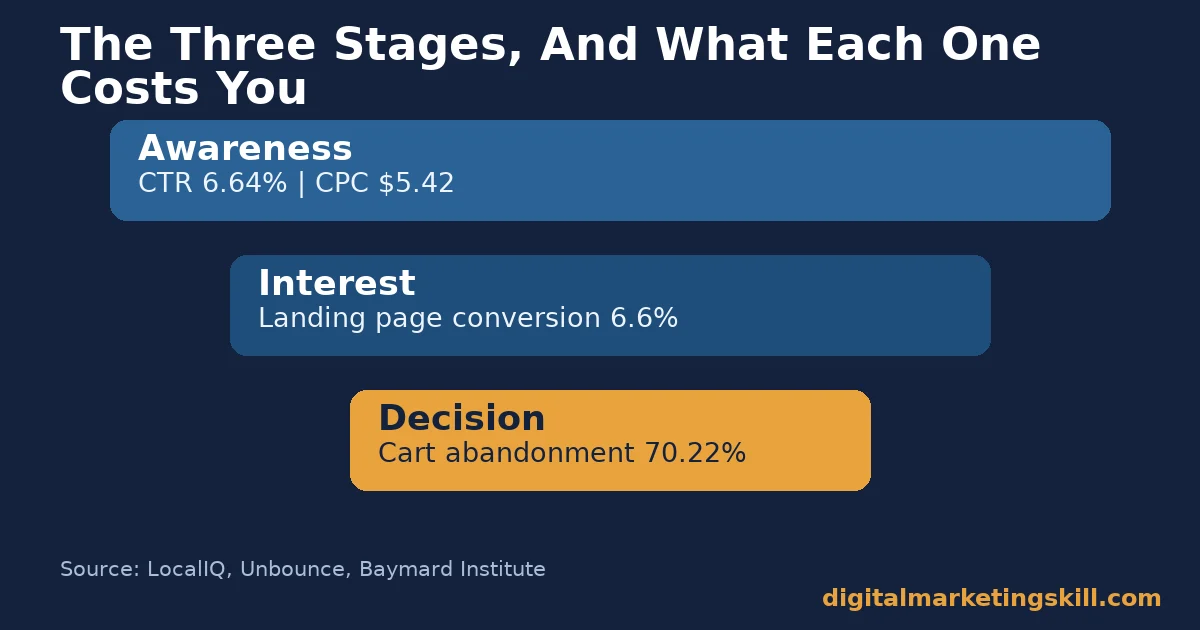
The awareness stage introduces a stranger to your brand for the first time. Its only job is reach. Getting in front of the right people matters here, not converting them yet. Search ads reach this stage at a measured click-through rate of 6.64%. Cost per click sits around $5.42 across industries, per LocalIQ’s benchmark data.
Judging the awareness stage by sales is a common mistake. After all, a good awareness channel earns attention. It does not need to close a sale on the first touch.
In other words, a bad awareness metric is not “low sales.” It is low reach among the right audience. Confusing the two metrics leads businesses to cut channels that were actually working exactly as designed.
A channel that reaches the right audience, at the right cost, has done its job once that audience clicks through to the next stage. Whatever happens after that click belongs to the interest stage, not the channel that brought the visitor there.
Interest: Built For Qualification
The interest stage filters a crowd of strangers down to people who actually want what you offer. A landing page is the clearest test of this stage. The median page converts visitors at 6.6%, across a dataset of 41,000 pages, per Unbounce.
Traffic source changes this number dramatically. Email traffic converts at roughly 14% in professional services and education. By comparison, paid social lags behind, at just 4.4% in the same report. The lesson is not “email beats social” in general. Rather, it is that intent, not channel popularity, drives this stage.
Therefore, before blaming your landing page copy for a weak conversion number, check the traffic source first. A low number from cold, low-intent traffic is not the same problem as a low number from a warm, high-intent list.
Decision: Built For Removing Friction
The decision stage is where a qualified lead chooses to buy, or quietly leaves. This is the stage with the largest measured leak. Average online cart abandonment sits at 70.22%, an aggregate of 50 separate studies from the Baymard Institute.
That number represents real, recoverable revenue. After all, a buyer who reached checkout already cleared the hardest part of the funnel. Losing them here is rarely about interest. Instead, it is almost always about friction: an extra form field, a confusing shipping cost, or a forced account signup.
How To Actually Fix Each Sales Funnel Stage
Knowing the benchmark for a stage is not the same as fixing it. Here is where to start on each one.
Awareness: Lead With One Channel, Not Five
Pick one awareness channel. Learn its real cost per lead before adding a second. LocalIQ’s data puts average cost per lead at $66.69 across industries. That figure swings from under $27 to over $130, depending on the category. Your own number, not the average, should decide your next move.
Only add a second channel once the first one is profitable on its own. Splitting a small budget across three untested channels usually produces three weak signals instead of one clear answer.
Interest: Lead With A Single Offer
A landing page with one offer and one call to action consistently outperforms a page trying to sell three things at once. Match your traffic source to your offer. A visitor from an email list already trusts you more than one from a cold social ad, so the offer can ask for more.
Keep the offer on the page identical to the offer in the ad or email that sent the visitor there. A mismatch between the promise and the page is one of the fastest ways to lose an otherwise qualified visitor at this stage.
Decision: Lead With An Abandonment Recovery Sequence
Build one automated sequence that follows up with anyone who reaches checkout without buying. Given Baymard’s 70.22% abandonment figure, even a modest recovery rate on that single sequence often outperforms an entire new acquisition campaign. Automated flows already carry outsized weight in revenue terms. They make up only 2% of email sends but drive 37% of all email-generated sales, per Omnisend.
Keep the sequence short: a reminder soon after the abandonment, a second message addressing a likely objection such as shipping cost, and a final nudge before the lead goes cold. Three well-timed messages usually outperform ten generic ones sent on a fixed schedule.
How To Measure Your Own Sales Funnel
Track one metric per stage, not a dozen vanity numbers. Compare each one to your own history first, and to the benchmarks above second. Over time, your own trend line matters more than any outside benchmark.
- Click-through rate: the share of people who see an ad or link and click it. LocalIQ’s average sits at 6.64%. It signals whether your awareness message is relevant to its audience.
- Landing page conversion rate: the share of visitors who complete your interest-stage offer. The 6.6% median from Unbounce is a reasonable starting benchmark.
- Cart or form abandonment rate: the share of people who start the decision stage but do not finish it. Compare your own rate to Baymard’s 70.22% average.
- Cost per lead: total spend divided by leads generated. LocalIQ’s $66.69 average is a reference point, not a target, since it varies heavily by industry.
- Stage-to-stage conversion rate: the percentage that moves from one stage to the next. This is the number that actually finds your leak.
Reading The Funnel Metrics Together
A healthy click-through rate paired with a weak landing page conversion rate points to a messaging mismatch. The ad and the offer are not saying the same thing. By contrast, a strong landing page paired with high cart abandonment points to friction later in the process. That is not a traffic or interest problem at all.
Read all five numbers as one connected system, not five isolated reports. Otherwise, fixing the wrong stage because a different number looked alarming wastes effort that the real leak needed.
A simple monthly habit works well here: list all five numbers in one place, side by side, before deciding what to fix next. The stage that stands out as the clear outlier is almost always the right place to start.
Resist the urge to fix two stages at once, even when two numbers both look weak. Changing one stage at a time is the only way to know which change actually caused the improvement you see afterward.
The One Decision Rule: Fix The Narrowest Stage First
Find the single stage with the sharpest percentage drop. Fix that stage before touching any other part of the funnel. A funnel with one severe leak wastes every improvement made elsewhere. The leak caps total output, regardless of what happens before or after it.
Illustrative, invented numbers: imagine 10,000 people see your ad. 600 click through. 180 reach your landing page offer. Only 9 ever check out. The sharpest drop is clearly checkout, not the ad. Fixing checkout friction first would likely outperform doubling ad spend, even though doubling ad spend feels like the more obvious move.
That is the trap of top-line thinking: doubling ad spend in this example would roughly double the 9 sales too, at full acquisition cost. Fixing the checkout leak could lift that number for free, using traffic you are already paying for.
This is why the stage-to-stage conversion rate matters more than any single top-line number. A funnel can look healthy on average while one stage quietly destroys most of its potential. In practice, most businesses only discover this once they actually plot the numbers stage by stage, rather than looking at a single blended conversion rate.
A Real Case: Fixing One Funnel Stage, Not The Whole Funnel
Graham & Brown, a UK home furnishings retailer, rebuilt its checkout into a single-page flow. Guest checkout became the default. Client-side validation caught errors before submission. According to the published case study, the result was an 11.6% lift in mobile conversion and a 10.23% lift in desktop conversion. The project paid for itself within roughly two weeks.
The lesson generalizes beyond this one business. Notably, the team did not redesign the whole site. Instead, they targeted the one stage, checkout, where Baymard’s industry-wide data shows the sales funnel leaks hardest. This is one published case study, not a guaranteed outcome, and results will vary by business and starting point. A different checkout, with a different audience and a different starting friction point, could see a smaller lift, or a larger one.
Notice the scope of what changed. Two specific friction points, a multi-page form and an unclear guest option, were the entire fix. Importantly, no new traffic, no new offer, and no redesign of the rest of the funnel was needed to produce that lift. The fix cost far less than the acquisition spend it protected.
Frequently Asked Questions About The Sales Funnel
What is a sales funnel in simple terms?
A sales funnel is a model of how a stranger becomes a customer. It breaks the journey into stages such as awareness, interest, and decision. Each stage narrows, since not everyone who enters moves to the next one.
What is the difference between a sales funnel and a marketing funnel?
The terms overlap heavily in practice. A marketing funnel usually describes the earlier stages: building awareness and interest. A sales funnel often emphasizes the later stages that end in a purchase. Many businesses use the terms interchangeably without losing meaning.
Which sales funnel stage usually leaks the most?
It varies by business, but the decision stage is a common culprit. Baymard’s data shows average cart abandonment above 70%. That makes checkout one of the highest-leverage stages to fix for many online businesses, though a service business may find its biggest leak earlier, at the interest stage instead.
How is a B2B sales funnel different from a B2C one?
A B2B sales funnel usually involves more decision-makers and a longer stretch between first contact and a signed deal. A B2C sales funnel typically moves faster. One person makes a quicker, more personal purchase decision. The stage benchmarks in this guide, drawn mostly from broad consumer and small-business data, should be treated as a starting reference for B2B funnels rather than an exact match.
Do I need special software to build a sales funnel?
No. A sales funnel is a model, not a piece of software. Many businesses run an effective one with a landing page tool, an email platform, and a simple spreadsheet to track the metrics above. The software makes execution easier; it does not replace the thinking behind the model itself.
How often should I review my sales funnel’s performance?
Review stage-to-stage conversion monthly at minimum. A single slow week rarely reflects a real trend. A consistent multi-month drop in one stage is the signal worth acting on. Seasonal businesses should also compare the same month year over year, not just against the previous month.
Can automation fix a leaking sales funnel on its own?
Automation helps capture value that is already there, such as recovering an abandoned cart. However, it cannot fix a fundamentally mismatched offer or audience on its own. Diagnose the stage first, using the benchmarks above. Automate the fix second, once you know exactly what you are fixing.
Does a sales funnel apply to service businesses, not just ecommerce?
Yes. A consultant, an agency, or a local service business all move a stranger through awareness, interest, and decision before a contract or booking happens. The stages stay the same; only the specific metrics at each one change. A service business might track a booked consultation instead of a checkout, but the underlying leak-finding logic is identical.
What is the biggest mistake businesses make with their sales funnel?
Treating the funnel as a one-time diagram rather than an ongoing measurement habit. A funnel built once and never revisited quietly goes stale as traffic sources, offers, and audiences all shift over time. Revisiting the numbers monthly keeps the model useful instead of decorative. The second most common mistake is changing several stages at once after a slow month, which makes it impossible to tell which change actually helped.
Where To Learn This Properly
Building and fixing a sales funnel end to end is exactly the kind of skill Digital Marketing Skill Institute‘s Master Diploma in Digital & AI Marketing is built to teach. The program runs as four AI-powered tracks built from ten courses in total. A dedicated AI-Powered Lead Generation and Email Automation track covers the interest and decision stages in this guide directly. A Full Stack option lets you complete all four tracks.
Every student gets unlimited 1-on-1 coaching and mentoring, plus a U.S. Project Internship with a verified U.S. Work Reference Letter, the kind of applied project experience that turns funnel theory into a real, checkable result. The program carries dual US and UK accreditation and is recognised in more than 100 countries, delivered 100% online. You can build these skills from anywhere in your country.
Browse more breakdowns like this one on the Digital Marketing Skill Institute blog, read more outcomes on the reviews page, or go straight to the Master Diploma program page for the full curriculum. Wherever you live, you can apply here to start. For related reading, see this breakdown of the ecommerce sales funnel, this guide to B2B lead generation, and this overview of marketing automation. Learn more about Digital Marketing Skill Institute whenever you’re ready.
Every figure in this guide was checked against its original source before publication. Figures marked as illustrative are invented examples, not real results.