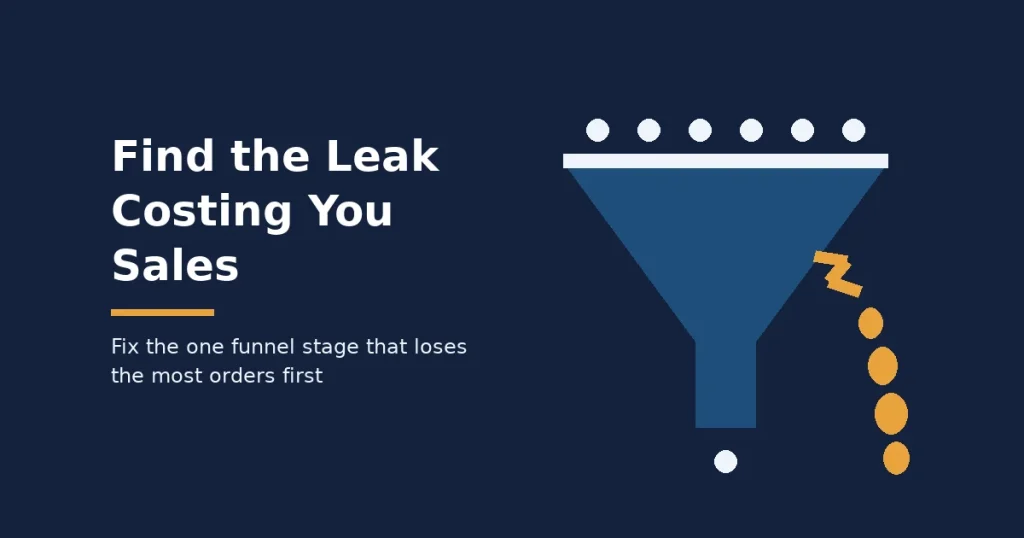
An ecommerce sales funnel is the path a shopper takes from first visit to paid order and repeat purchase. It has five stages: discovery, product page, cart, checkout and after-sale. Most stores lose buyers at one stage more than the others. Find that stage with your own data, fix it first, and measure the gain before touching anything else.
Key Takeaways
- Only a small share of visits turn into orders. Dynamic Yield’s benchmark database puts the average ecommerce conversion rate at 2.72%. So a store with 10,000 sessions should expect about 270 orders, not thousands.
- The cart is where most intent dies. Dynamic Yield reports an average cart abandonment rate of 77.55%. Baymard Institute’s average across 50 studies is 70.22%.
- Surprise costs are the top reason for abandoning a checkout. In Baymard Institute’s survey of US shoppers, 40% left because extra costs such as shipping and fees were too high.
- Speed moves every stage. In a study for Google by 55 and Deloitte, a 0.1-second faster mobile site lifted retail conversions by 8.4%.
- Recovery works but does not replace fixing the leak. Klaviyo’s analysis of more than 143,000 abandoned cart flows found an average placed order rate of 3.33%.
In this guide
- Why Most Ecommerce Sales Funnel Advice Misses the Leak
- How an Ecommerce Sales Funnel Actually Loses Shoppers
- What Breaks at Each Stage of the Ecommerce Sales Funnel
- How to Fix Each Stage: What to Lead With
- How to Measure Your Ecommerce Sales Funnel
- The One Rule: Fix the Stage That Loses the Most Orders
- What Fixing an Ecommerce Sales Funnel Looks Like in Practice
- Frequently Asked Questions About Ecommerce Sales Funnels
- Start With One Stage and Build From There
Why Most Ecommerce Sales Funnel Advice Misses the Leak
Most funnel guides describe the stages and then list twenty tactics. That skips the one question a store owner needs answered. Where are shoppers leaving, and which fix will win back the most orders? A list of tactics treats every stage as equally broken, and in practice they rarely are.
This guide fills that gap. It explains how the stages of an ecommerce sales funnel multiply and what breaks at each one. Then it shows which fix to lead with, and how to decide where to spend your next week of work. The goal is one decision you can act on, not a checklist you will never finish.
First, some ground rules. Every benchmark below comes from a named dataset, and each one measures something slightly different. Dynamic Yield, for example, finds mobile converting better than desktop, while Contentsquare’s benchmark finds the reverse. So treat any benchmark as a snapshot, not a permanent ranking, and treat your own history as the real baseline.
Where this guide interprets the data, it says so. The claim that most stores have one dominant leak is an informed inference from how the stage rates multiply, not a settled fact. You will test it on your own store in the measurement section.
How an Ecommerce Sales Funnel Actually Loses Shoppers
An ecommerce sales funnel is a chain of rates, and each rate multiplies the one before it. The overall conversion rate is simply the product of every stage rate. That is why a small gain at a weak stage can beat a big gain at a strong one.
Google Analytics describes the chain in its recommended ecommerce events. A shopper sees a product list, views an item and adds it to the cart. Then they begin checkout, add shipping and payment details, and buy. Each event marks a gate, and each gate loses some people.
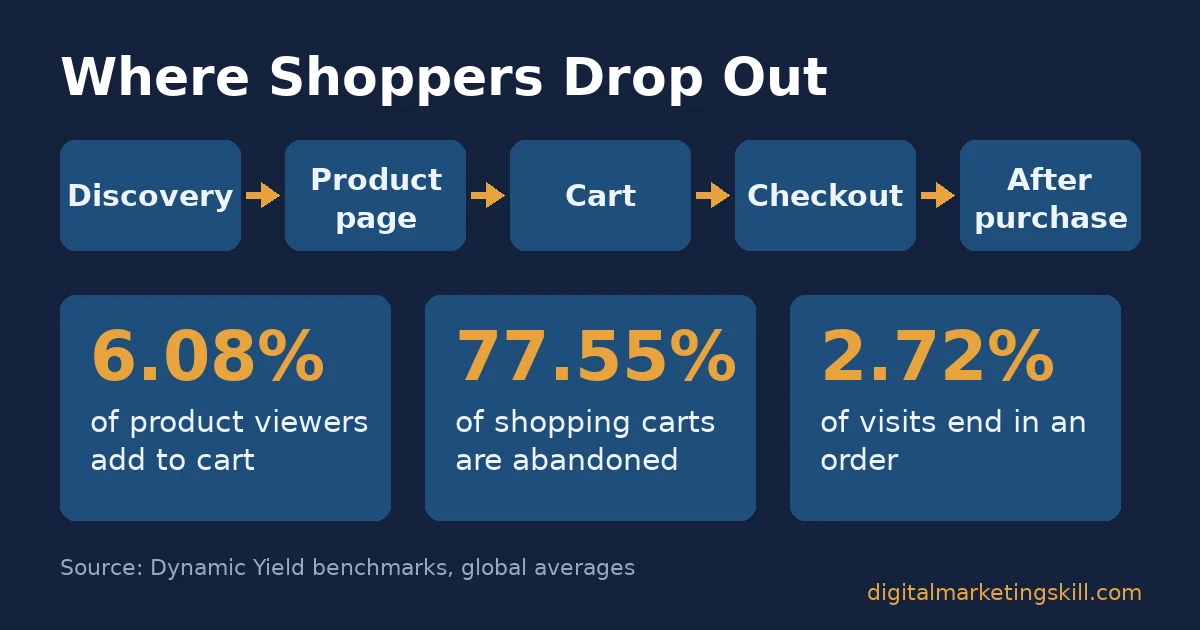
Here is how the stages look in plain words:
- Discovery: the visitor lands and finds a relevant product through search, a category page or an ad.
- Product page: the visitor decides whether this item is right, trustworthy and worth the price.
- Cart: the visitor commits to an item but has not yet seen the full cost.
- Checkout: the visitor enters details and pays, or leaves at the last step.
- After purchase: the customer either buys again or never comes back.
Why the Stages Multiply Instead of Adding Up
The multiplication explains why whole-site conversion is so low. Dynamic Yield’s add-to-cart benchmark averages 6.08% after product page views. Its cart abandonment benchmark averages 77.55%, which means only about 22 of every 100 carts become orders.
Now combine them. Say 6 in 100 product viewers add to cart, and 22 in 100 carts convert. Then only about 1.3 in 100 product viewers buy. That is my arithmetic from two separate benchmarks, so treat it as a rough guide. However, it shows why stage rates beat the headline number for diagnosis.
It also shows why a single blended conversion rate can hide a problem. Two stores can both convert at 2%, yet one loses shoppers on the product page and the other loses them at checkout. The same headline number needs two very different fixes, which is why you should always break your ecommerce sales funnel into stages.
What Breaks at Each Stage of the Ecommerce Sales Funnel
Every stage fails for a different reason. So the fix that works at the product page will do almost nothing at checkout. The headings below state what each stage is built for, because a stage fails when it stops doing that one job.
Discovery: Built for Relevance
Discovery is the top of the ecommerce sales funnel. It exists to put the right product in front of the right visitor quickly. It breaks when ads, search results or category pages send people to items that do not match what they wanted. The symptom is a high share of sessions that never reach a product page.
Device matters here too. Contentsquare’s Digital Experience Benchmark, which covers 99 billion sessions across 6,500 websites, found that mobile brings about 70% of visits. Yet desktop converted at 3.4% against 2% on mobile in that dataset, so mobile discovery deserves extra attention.
Product Page: Built for Confidence
The product page exists to answer every doubt before the shopper asks it. It breaks when photos are thin, sizing or specs are vague, delivery cost is hidden, or the page loads slowly. The symptom is a low add-to-cart rate from people who clearly viewed the item.
Speed alone can move this stage. The Milliseconds Make Millions study was run by 55 and Deloitte for Google across 37 brand sites. In it, a 0.1-second faster mobile load raised progression from product page to basket by 40.1% for luxury brands. Google commissioned that research, which is worth remembering when you read it.
Cart: Built for Commitment
The cart exists to turn interest into a decision. It breaks when the shopper uses it as a wishlist, a price calculator or a place to park items while comparing other stores. The symptom is a high cart abandonment rate, which is the norm rather than the exception.
Baymard Institute, a research firm that studies checkout usability, averages 50 separate studies and reports a documented abandonment rate of 70.22%. Some of that loss is unavoidable, because many people add items with no intent to buy yet. Still, the gap between your rate and your own best month is recoverable.
Checkout: Built for Speed and Trust
Checkout exists to take money with as little effort and doubt as possible. It breaks on surprise costs, forced account creation, long forms and missing payment options. The symptom is a big drop between shoppers who begin checkout and shoppers who complete it.
Baymard’s survey of US online shoppers ranks the reasons. Extra costs caused 40% of abandonments, slow delivery 20%, lack of trust with card details 19%, forced account creation 18% and a long or complicated checkout 17%. These are US figures, so check how shoppers in your own market behave before copying them.
After Purchase: Built for the Second Order
The after-purchase stage exists to earn the next order. It breaks when the store goes silent after the confirmation email or floods the customer with generic promotions. The symptom is a low share of customers who order again.
This stage is cheap to fix and expensive to ignore. Harvard Business Review, citing research on customer economics, notes that acquiring a new customer costs five to 25 times more than keeping an existing one. That range is wide and depends on the industry, but the direction is consistent.
How to Fix Each Stage: What to Lead With
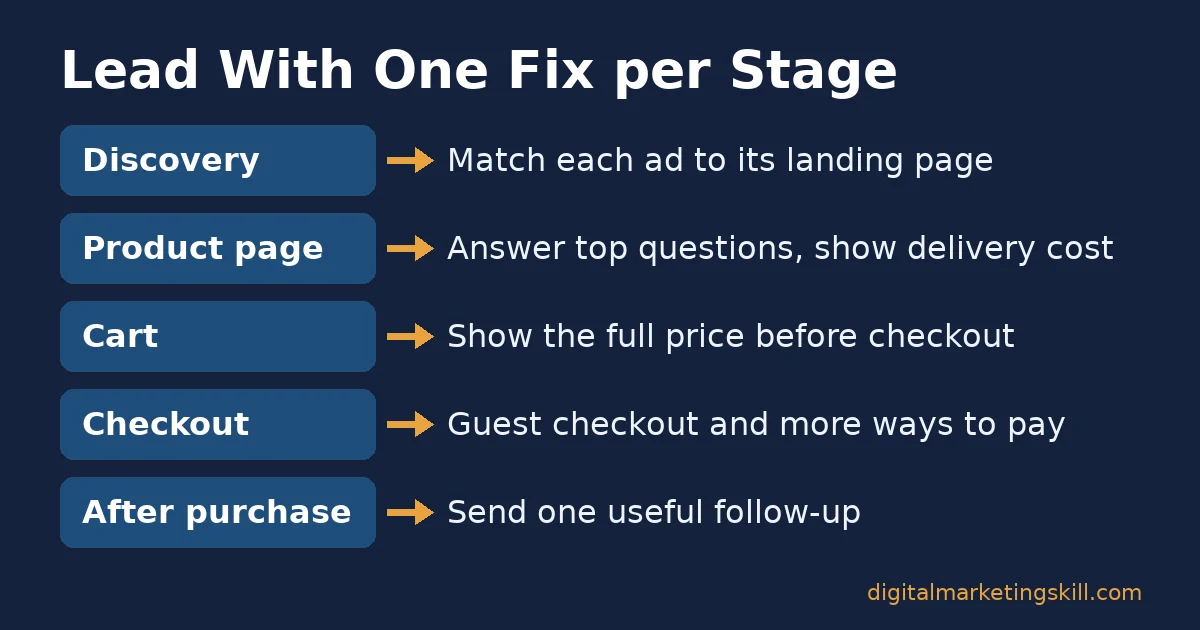
Each fix below mirrors one stage above. Lead with the first action listed, because it addresses the most common cause. Then measure it before adding the next change, so you know what actually worked.
Discovery: Lead With Matching Intent
Start by matching every traffic source to the page it lands on. An ad for running shoes should land on running shoes, not the home page. Then check on-site search: type your ten most common product queries and fix any that return nothing useful.
After that, review mobile layouts first, because that is where most visits arrive. If you use paid social or display ads, keep retargeting for later stages. Our guide to retargeting ads explains how to aim them at people who already viewed a product.
Product Page: Lead With Answers
Lead with the questions shoppers actually ask. Read your customer service emails, reviews and returns reasons, then answer the top five on the product page itself. Show delivery cost and timing near the price, because hidden costs surface later as cart abandonment.
Next, test speed on a real phone. Aim for the Core Web Vitals “good” thresholds, including a Largest Contentful Paint of 2.5 seconds or less. Our guide to turning phone traffic into sales covers the mobile fixes in more depth.
Cart: Lead With the Full Price
Lead with total cost transparency. Show shipping, taxes and fees in the cart, or give a delivery estimate from a postcode. When the final price matches what shoppers expected, fewer of them leave to compare.
Then set up a recovery sequence for carts that stall. Klaviyo’s abandoned cart benchmark report found average flows reach a 50.5% open rate and a 3.33% placed order rate. The top 10% of flows reach 7.69%. Klaviyo sells email software, and its data covers its own customers only.
A good ecommerce sales funnel treats those emails as a backstop, not a strategy. Our email automation strategy guide shows how to build the sequence without spamming people.
Checkout: Lead With Fewer Steps and More Ways to Pay
Lead with guest checkout. Google’s web.dev guidance on payment and address forms recommends making guest checkout the default and using browser autofill, so shoppers type less. Remove every field you do not need to ship the order.
Next, add the payment methods your customers already use. Stripe’s holdback experiment across 50-plus payment methods tested what happens when stores offer at least one relevant method beyond cards. On average, conversion rose 7.4% and revenue rose 12%. Stripe sells payments, and results varied widely by country.
After Purchase: Lead With a Useful Follow-Up
Lead with one genuinely useful message after delivery. That could be care instructions, a setup guide or a reorder reminder timed to when the product runs out. Useful beats promotional, because it gives the customer a reason to open the next email.
Then ask for a review and make the second order easy. Saved addresses, order history and one-click reorder all reduce effort. As a result, your ecommerce sales funnel starts to feed itself instead of relying on new traffic alone.
How to Measure Your Ecommerce Sales Funnel
You cannot fix a stage you cannot see. So before changing anything, set up tracking for each gate. In Google Analytics, the recommended events include view_item, add_to_cart, begin_checkout and purchase, and a funnel exploration report can chart them in order.
Shopify stores get similar numbers without extra setup. Its behaviour reports documentation defines sessions with cart additions, sessions that reached checkout and sessions that completed checkout. It also notes that one session can hold several purchases, so session counts and order counts can differ.
Track these five KPIs, each defined in one sentence:
- Product view rate: the share of sessions that view at least one product page; low numbers point to a discovery problem.
- Add-to-cart rate: the share of product viewers who add an item to the cart; compare it to your own best month first.
- Checkout start rate: the share of carts that begin checkout; a drop here usually means the full price surprised people.
- Checkout completion rate: the share of started checkouts that end in payment; a drop here points to forms, trust or payment options.
- Repeat purchase rate: the share of customers who place a second order within a set window you choose, such as 90 days.
How to Read the Numbers Together
Read them together rather than alone. For instance, a rising add-to-cart rate with a falling checkout start rate often means you attracted more bargain hunters, not better buyers. Also split every KPI by device, because mobile and desktop often behave very differently.
Give each change enough time and traffic to show a real effect. A week of data from a small store can swing wildly, so compare full weeks and note any sales or holidays. If a KPI moves less than its normal week-to-week swing, treat the result as noise and keep testing.
If you are new to the reports, our Google Analytics for beginners guide walks through the setup step by step.
The One Rule: Fix the Stage That Loses the Most Orders
This is the most useful idea in the whole guide. Do not fix the stage with the worst-looking percentage. Instead, fix the stage where closing the gap to your target would recover the most completed orders.
Decision rule: for each stage, multiply the shoppers who reach it by the gap between your rate and your target rate, then by the share who would complete every later stage. Work on the stage with the biggest result first.
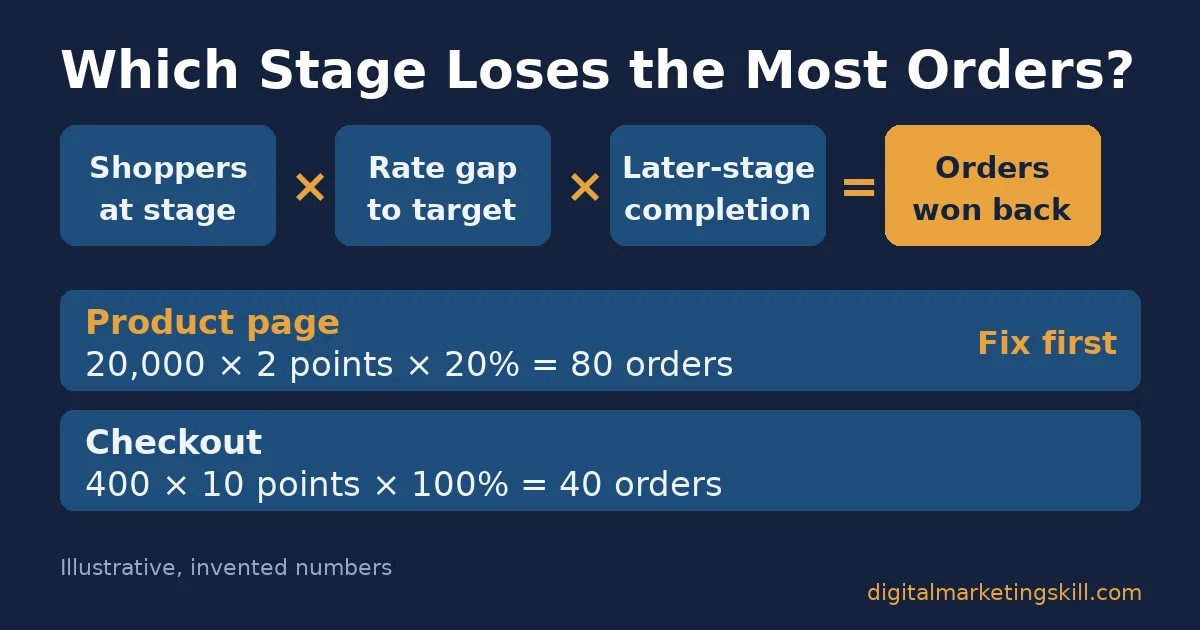
Here is a worked example with illustrative, invented numbers. A store has 20,000 product viewers a month. Its add-to-cart rate is 5% against a 7% target, so 400 extra carts are possible. Because 20% of carts convert, that fix is worth about 80 orders.
The same store sees 1,000 carts, and 40% of them start checkout. Of those starts, 50% complete payment against a 60% target. Closing that gap adds 10% of 400 starts, which is 40 orders. So in this example, the product page wins even though checkout looks worse.
Run the numbers on your own ecommerce sales funnel before you choose. The answer often surprises people, because the loudest problem is not always the most valuable one.
What Fixing an Ecommerce Sales Funnel Looks Like in Practice
Published company cases show how an ecommerce sales funnel improves in practice: one targeted change at one stage, then measured results. The Vodafone case study on web.dev is a good example. The company ran an A/B test on a landing page and split paid traffic evenly between two versions.
Its optimised version had a 31% better Largest Contentful Paint. It produced 8% more sales, a 15% better lead-to-visit rate and an 11% better cart-to-visit rate. Vodafone isolated one variable, page speed, and measured the effect at several stages of the funnel at once.
The limits matter. This was one company, one page and one type of traffic, and web.dev withheld the absolute numbers. So the case shows that speed can move cart behaviour, not that every store will see the same lift.
Smaller operators follow the same logic. Eunice Bolaji is a Digital Marketing Skill Institute student. In a published review, they said they built “a full blown Ecommerce site from the scratch while still learning.” That is one person’s account, and results vary; see our earnings disclaimer before reading any student story as a promise.
Frequently Asked Questions About Ecommerce Sales Funnels
What are the stages of an ecommerce sales funnel?
The main stages are discovery, product page, cart, checkout and after-purchase. Google Analytics tracks them with events such as view_item, add_to_cart, begin_checkout and purchase.
What is a good conversion rate for an online store?
Dynamic Yield’s benchmark puts the global average ecommerce conversion rate at 2.72%. Even so, your own history is a better target than any industry average.
Why do shoppers abandon their carts?
Extra costs such as shipping, taxes and fees are the top reason. In Baymard Institute’s survey of US shoppers, 40% of those who abandoned a checkout gave that reason.
Do abandoned cart emails really work?
Yes, within limits. Klaviyo’s analysis of more than 143,000 abandoned cart flows found an average placed order rate of 3.33%, so they recover some sales but not most.
How is an ecommerce funnel different from a general sales funnel?
An ecommerce sales funnel ends in an online checkout that the shopper completes alone. So page speed, total cost and payment options matter more than a salesperson’s follow-up. Our guide to building a sales funnel covers the general model.
Which stage should I fix first?
Fix the stage where closing the gap to your target would recover the most completed orders. To find it, multiply traffic, rate gap and later-stage completion for each stage.
Start With One Stage and Build From There
The fastest way to grow sales is rarely more traffic. Instead, measure each gate of your ecommerce sales funnel, find the stage that loses the most orders, fix it, and measure again. Then repeat with the next stage.
To build these skills properly, look at the Master Diploma in Digital & AI Marketing at Digital Marketing Skill Institute It has nine practical courses, including AI-Powered WordPress Website & eCommerce Development, AI-Powered Lead Generation, Email Marketing & Automation, and AI-Powered Google Analytics.
You also get unlimited 1-on-1 coaching and mentoring, plus real project work inside a U.S. company. The diploma is dual US and UK accredited and recognised in more than 100 countries. Because the programme is 100% online, you can study from anywhere in your country. The same funnel method works for a store in any market, wherever you live.
You can read more practical guides on the Digital Marketing Skill Institute blog. You can also visit the Digital Marketing Skill Institute home page, or apply for the Master Diploma when you are ready.
Every figure in this guide was checked against its original source before publication. Figures marked as illustrative are invented examples, not real results.
![9 Amazing Digital Marketing Skills to Make Money Online [With Proof]](https://digitalmarketingskill.com/wp-content/uploads/2019/07/9-Amazing-Digital-Marketing-Skills-to-Make-Money-Online-With-Proof-17.png)