

Digital marketing KPIs fail most teams for a simple reason: they track too many, and most never change a decision. This guide explains how KPIs should actually drive action. It covers which few are worth tracking at each funnel stage, and one rule for dropping the rest.
Key Takeaways
- Most data goes unused. The CMO Survey from Duke University’s Fuqua School of Business found marketing analytics inform only 37.2% of decisions. That gap holds even when the data is already available.
- Few teams check their own numbers. The same CMO Survey found 67% of marketing leaders say their company does not formally evaluate the quality of its own marketing analytics.
- Evaluation changes everything. Teams that do formally evaluate their analytics use them in 49% of decisions, against 32% for teams that do not.
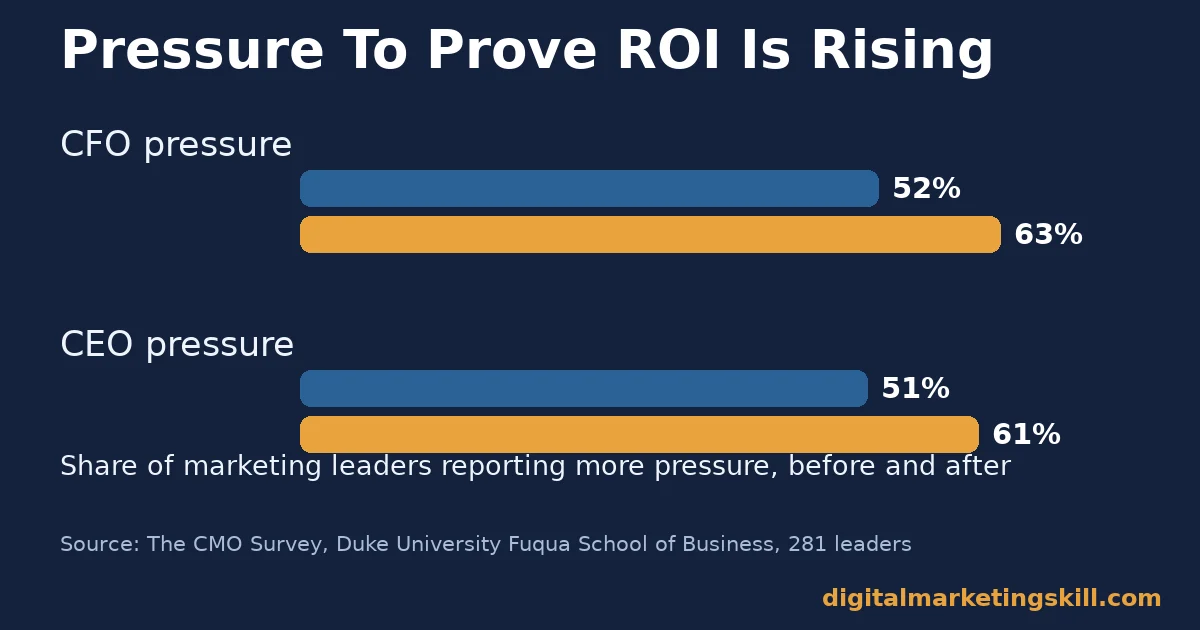
- Pressure to prove results is rising fast. A more recent CMO Survey of 281 marketing leaders found 63% report more pressure from CFOs to prove ROI, up from 52%. It found 61% report more pressure from CEOs, up from 51%.
- Benchmarks shift under you. Contentsquare’s Digital Experience Benchmark, built from 90 billion sessions across 6,000 websites, found conversion rates fell 6.1% year over year. A static target can quietly go stale.
In this guide
- What Most “KPIs to Track” Lists Get Wrong
- How Digital Marketing KPIs Actually Drive Decisions
- What Differs by Funnel Stage
- How to Choose KPIs for Each Stage
- The KPI Categories Worth a Place on Any Dashboard
- How to Judge Whether a KPI Is Worth Tracking
- The One Rule: If a KPI Can’t Change a Decision, Drop It
- A Real Case: How Google Replaced Scattered Metrics With a Framework
- Frequently Asked Questions About Digital Marketing KPIs
- Start by Cutting Your Dashboard, Not Growing It
What Most “KPIs to Track” Lists Get Wrong
Most articles about digital marketing KPIs are long, numbered lists. They name a metric for every channel. Then they leave you to decide which ones matter.
That approach treats measurement as a shopping list rather than a decision tool. It is a large part of why so much marketing data goes unused.
This guide starts from the opposite direction. It explains why most tracked metrics never inform a decision. Readers get a short list of which digital marketing KPIs earn a place on a dashboard at each stage of the funnel. One rule for dropping a weak metric closes out the guide.
A few ground rules first. The CMO Survey and Contentsquare figures below are self-reported and vendor-collected. Treat them as informed snapshots of the industry, not settled facts about your own business. Benchmarks also drift, as the Contentsquare figure shows, so read every number here as a snapshot, not a permanent target.
How Digital Marketing KPIs Actually Drive Decisions
A KPI only earns its place on a dashboard if it can change what someone does next. If a number can rise or fall without anyone changing a budget, a headline, or a campaign, it is not a KPI. It is just a number with a chart around it.
Most teams get this backwards. They pick a metric because a platform reports it by default, not because it maps to a goal. Google’s own research team formalised the fix for this with a method called Goals-Signals-Metrics. Define the goal first. Decide what user or customer behaviour would signal progress toward it. Only then choose the metric that captures that signal.
This problem shows up at industry scale too. The CMO Survey is run by Duke University’s Fuqua School of Business. It found that marketing analytics inform only 37.2% of marketing decisions, even in companies that have the data on hand.
Data availability is not the real gap. A missing link between the number and the decision is.
The Pressure to Prove ROI Is Rising
That gap is becoming harder to ignore. A more recent edition of the same CMO Survey covered 281 marketing leaders at VP level or higher. It found 63% report more pressure from their CFO to prove ROI, up from 52% two years earlier. Pressure from CEOs rose from 51% to 61% over the same period.
Teams that formally evaluate the quality of their own analytics use them far more often. The rate reaches 49% of decisions, against 32% for teams that skip that step. Yet the same survey found 67% of marketing leaders admit their company does not formally evaluate its analytics at all. Fixing that evaluation gap is usually cheaper than adding another dashboard.
A simple evaluation step can be as small as a quarterly fifteen-minute review. Ask whether each metric still maps to a goal and still has a named owner. Then ask whether anyone actually changed a decision because of it in the last three months.
Teams that run even this light version of the check tend to retire several metrics a year without missing them. The review itself rarely takes longer than the time it saves in a single cluttered weekly meeting, and it keeps the whole dashboard honest.
What Differs by Funnel Stage
A KPI that matters at the top of the funnel can be meaningless at the bottom. The reverse is also true. Each stage has a different job. Each one needs its own small set of digital marketing KPIs, not one dashboard shared by everyone.
Awareness and Acquisition: Built to Test Reach
At this stage, the job is getting in front of the right people at a workable cost. Reach and impressions describe exposure. Cost per acquisition and cost per click describe whether that exposure is affordable.
Watch cost trends more closely than raw reach. Reach can grow while cost quietly climbs past what a sale is worth. A campaign can look healthy on a reach chart while losing money underneath it.
Engagement and Conversion: Built to Test Relevance
Once someone arrives, the question changes from “did they see it” to “did it matter to them.” Conversion rate, engagement rate, and click-through rate each test a different part of the message against the audience that received it.
Google Analytics counts a session as engaged once it passes 10 seconds, includes a key event, or has two or more page views. That is a useful baseline definition if your own platform leaves the term undefined, and it keeps teams from arguing over what “engaged” even means before they look at a single number.
A healthy acquisition number paired with a weak conversion rate usually points to a mismatch. The promise made in the ad rarely matches the page that follows it, and that gap is exactly what conversion rate exposes.
Retention and Revenue: Built to Test Long-Term Value
The last stage asks whether a customer was worth acquiring at all. Customer lifetime value, churn rate and return on ad spend only make sense once real behaviour has had time to show. A first purchase alone tells you almost nothing about long-term value.
Judging a campaign on acquisition cost alone can make a genuinely unprofitable channel look like a success. That false positive can persist for months before retention data reveals the real picture.
How to Choose KPIs for Each Stage
The sections below mirror the three stages above. Pick the stage where your team is flying blind right now. That is where a new KPI will change the most decisions, not the stage you already measure well.
Awareness and Acquisition: Lead With Cost, Not Reach
Track cost per acquisition and cost per click as your primary digital marketing KPIs here. Treat reach and impressions as context rather than targets. Set a maximum acceptable cost before a campaign starts. A rising number then triggers a real decision instead of a shrug.
Engagement and Conversion: Lead With One Page at a Time
Measure conversion rate per page or per campaign rather than as a single site-wide figure. A site average can hide a badly underperforming page behind a few strong ones. For a deeper walkthrough of fixing the pages themselves, see our guide to increasing your website conversion rate.
Retention and Revenue: Lead With a Minimum Time Window
Do not judge retention or lifetime value before enough time has passed for the pattern to show. In most small businesses that means waiting at least one full purchase cycle before trusting the number.
Pair retention tracking with your marketing channel mix. Some channels bring in cheaper customers who also churn faster, and that trade-off only shows up once you track both numbers side by side.
The KPI Categories Worth a Place on Any Dashboard
Instead of memorising seventeen individual metrics, it helps to know the handful of categories they fall into. Pick one or two digital marketing KPIs from each category that genuinely fit your goal, and leave the rest for later.
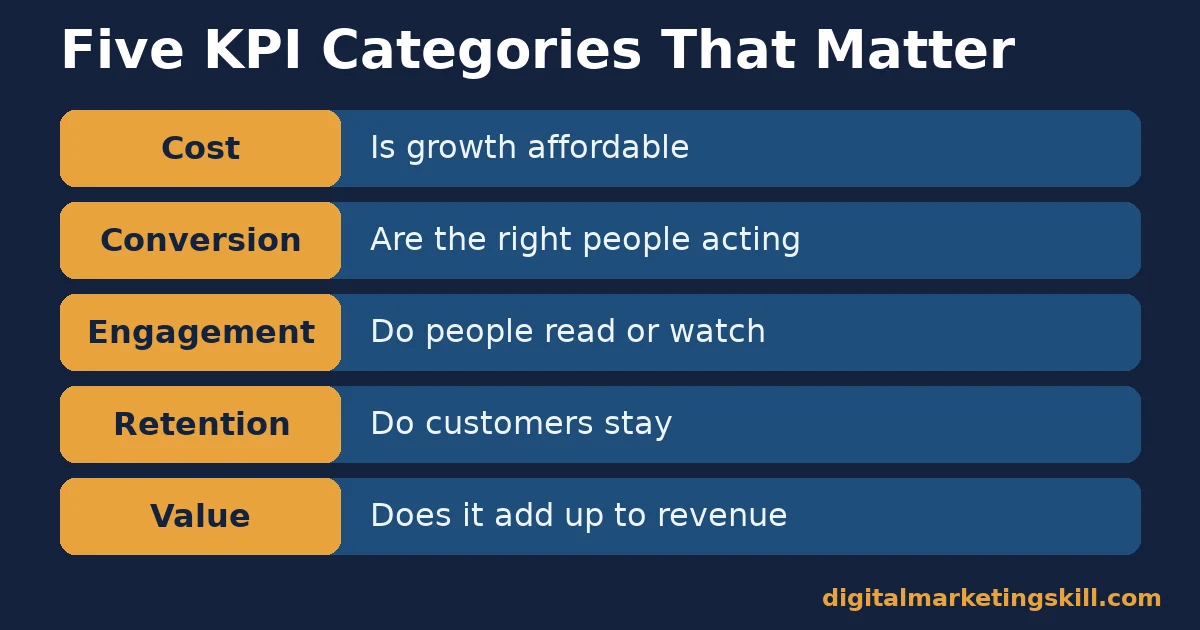
- Cost metrics. Cost per acquisition and cost per click answer whether growth is affordable. These are the first numbers to check when a channel’s volume looks good but margins do not.
- Conversion metrics. Conversion rate and click-through rate test whether the right people are taking the next step. Contentsquare’s benchmark, built from 90 billion sessions, found conversion rates fell 6.1% year over year industry-wide. That is a reminder to compare your own trend, not just a fixed number.
- Engagement metrics. Time on page, scroll depth and content engagement show whether people who arrive actually read or watch what you made for them.
- Retention metrics. Churn rate and repeat purchase rate show whether customers stay once they convert, which is often where real profit is decided.
- Value metrics. Customer lifetime value and return on ad spend tie everything above back to revenue, and should be the final check before scaling any channel.
Give Every KPI a Named Owner
A category only earns its place once a real person is responsible for acting on it. Write the owner’s name next to each metric on the dashboard, not just the category label. A cost metric with no owner tends to drift upward for months before anyone notices, simply because reacting to it was nobody’s job.
This also protects against a common failure mode: a dashboard that looks complete because every category is represented, while no single person could explain what changed last month or why. Naming an owner turns a report into a responsibility.
Which Category to Fix First
Start with the category tied to the decision you are actually about to make. If you are choosing where to spend next month’s budget, cost metrics matter most. If you are deciding whether to redesign a landing page, conversion metrics matter most instead.
Picking the category before picking the metric keeps a dashboard from growing past what anyone can realistically act on in a normal week.
It also makes handoffs between team members far easier. A new hire who understands the five categories can find their footing in a day, while a dashboard built from seventeen unrelated metrics takes weeks to learn and even longer to trust.
How to Judge Whether a KPI Is Worth Tracking
Before adding a number to a dashboard, run it through a short checklist. Each test below is defined in one sentence, with a note on what it rules out.
These four tests apply to any of the digital marketing KPIs listed in this guide, whatever stage of the funnel they measure. A metric that fails even one test is worth questioning before it earns a permanent spot.
Four Tests Every KPI Should Pass
- Tied to a goal. The metric should map to a specific business goal, the way Google’s Goals-Signals-Metrics process requires, not just to whatever a platform reports by default.
- Owned by someone. One named person should be responsible for reacting when the number moves, or it will simply be watched rather than acted on.
- Comparable over time. The metric needs a consistent definition and data source, so this month’s number means the same thing as last month’s.
- Able to change a decision. If neither a rise nor a fall in the number would change a budget, a page, or a campaign, it fails the core test from earlier in this guide.
How to Read a Small KPI Set Together
Read cost and conversion metrics side by side first. Together they show whether growth is both happening and affordable, which neither number tells you on its own.
Only bring in retention and value metrics once a channel has enough volume and time behind it to measure them honestly. A handful of digital marketing KPIs read together, in the right order, outperforms seventeen read in isolation.
This order matters because each layer answers a different question, and skipping ahead gives a false sense of certainty. Checking retention on a channel that only launched last week, before cost and conversion have even settled, produces a number that looks precise but means almost nothing yet.
A simple weekly habit works well here: glance at cost and conversion every week, check engagement every two weeks, and review retention and value once a month. That cadence matches how fast each layer of data actually changes, rather than forcing every number onto the same calendar.
The One Rule: If a KPI Can’t Change a Decision, Drop It
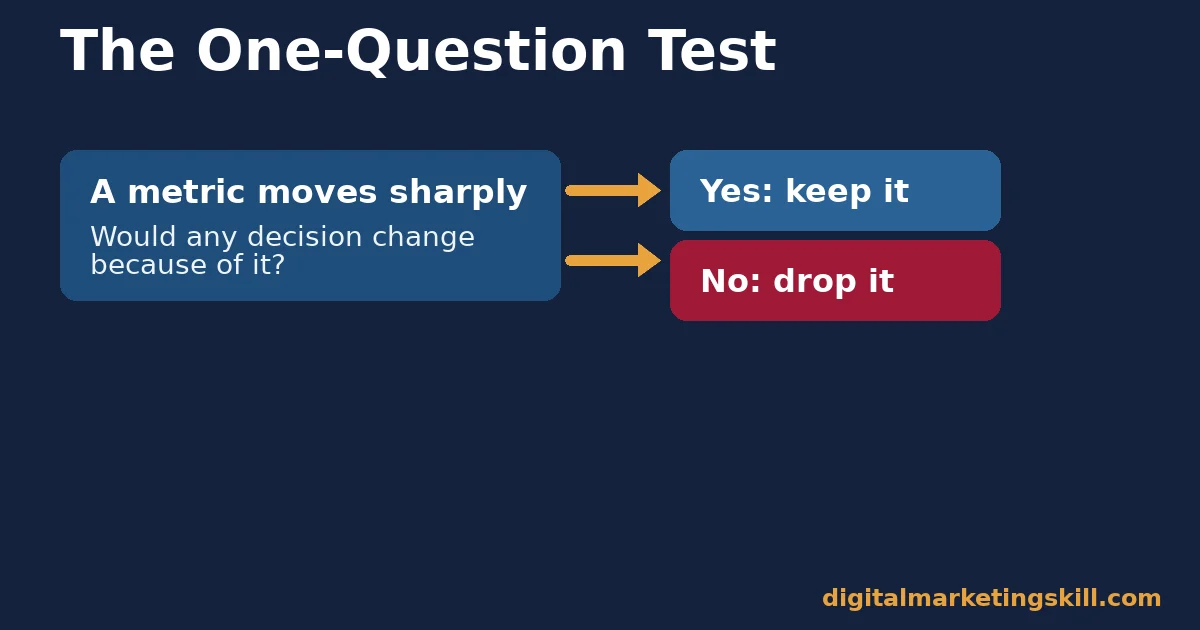
Take one rule from this guide and make it this one. Before a new metric earns a spot on your dashboard, ask what decision would change if it moved sharply in either direction.
If you cannot name that decision, the metric does not belong there yet. It does not matter how easy it is to pull from your platform, or how many other teams track it by default.
Here is an illustrative example, with invented numbers. A small team tracks fourteen metrics on a weekly dashboard, but only reviews five of them in any real detail. They run the test above against the other nine and find that six cannot be tied to any decision anyone actually makes.
Removing those six does not lose any real information, because nobody was acting on them anyway. The weekly review shrinks from forty minutes to fifteen, and the team spends the time saved actually discussing the five numbers that matter.
A Real Case: How Google Replaced Scattered Metrics With a Framework
Google’s own research team, Kerry Rodden, Hilary Hutchinson and Xin Fu, published a method for this exact problem in a paper called “Measuring the User Experience on a Large Scale.” Their teams faced the same issue many marketing teams face. There was no shared way to decide which metrics actually mattered across different products.
Their answer was the HEART framework. It was paired with the Goals-Signals-Metrics process described earlier in this guide: name the goal, name the signal that shows progress, then pick the metric. According to the paper’s own abstract, the method “generalised to enough of our company’s own products” that the authors were confident other teams could reuse it.
Read the limits honestly. This is a user-experience research framework from one large technology company, not a marketing ROI case study. The dollar outcomes will differ for a small business.
The transferable lesson is the sequence. Decide the goal and the decision first, and let that choice tell you which metric to track, rather than the other way round. The same discipline applies one level up, to the tools themselves: see our guide to marketing analytics tools for when a second or third tool is actually worth adding.
Frequently Asked Questions About Digital Marketing KPIs
What are digital marketing KPIs?
Digital marketing KPIs are the specific, measurable numbers a team tracks to judge progress toward a goal, such as cost per acquisition, conversion rate or customer lifetime value. A good KPI can change a real decision when it moves.
How many digital marketing KPIs should a small business track?
Usually five to eight, drawn from no more than two or three of the categories in this guide. More than that tends to dilute attention rather than add insight.
Why do so many marketing metrics go unused?
The CMO Survey found marketing analytics inform only 37.2% of decisions, largely because teams do not formally evaluate whether their data is trustworthy or tied to a real decision before tracking it.
What is the difference between a KPI and a vanity metric?
A KPI is tied to a specific goal and a specific decision. A vanity metric, such as raw page views or follower counts on their own, can rise or fall without telling anyone what to do next.
How often should digital marketing KPIs be reviewed?
Weekly for cost and conversion metrics, since they move fast enough to need quick decisions. Monthly or quarterly for retention and lifetime value, since those need more time to show a reliable pattern.
Should every channel use the same KPIs?
No. Each channel can use a different mix from the same five categories, but the categories themselves, cost, conversion, engagement, retention and value, stay consistent so results are comparable across channels.
What should I do if a KPI stays flat for months?
Check first whether it is still tied to a real decision. A flat KPI that nobody acts on either way is a strong candidate to drop under the one rule in this guide.
Can two teams disagree about which digital marketing KPIs matter?
Yes, and that is usually a sign the goal was never agreed on, not that one team is wrong. Go back to the Goals-Signals-Metrics method earlier in this guide and confirm both teams are working from the same goal before arguing about the metric.
Start by Cutting Your Dashboard, Not Growing It
Before adding another digital marketing KPI, run your current dashboard through the four tests above and drop anything that fails. Most teams find their real decisions rest on fewer than ten numbers, not seventeen.
If you want structured, hands-on practice building measurement that actually drives decisions, Digital Marketing Skill Institute teaches it inside the Master Diploma in Digital & AI Marketing. The AI-Powered Google Specialist track covers analytics and KPI selection in depth, and all four AI-powered tracks can combine into a Full Stack diploma covering the full customer journey.
The programme includes unlimited 1-on-1 coaching and mentoring, plus a U.S. Project Internship with a verified U.S. Work Reference Letter. It is dual US and UK accredited and recognised in more than 100 countries.
The programme is fully online, so you can build these measurement skills from anywhere in your country. Browse more guides on the Digital Marketing Skill Institute blog, or when you are ready, apply for the Master Diploma or start from the Digital Marketing Skill Institute homepage.
Every figure in this guide was checked against its original source before publication. Figures marked as illustrative are invented examples, not real results.