
TAM, SAM and SOM are three ways of sizing a market. TAM, the total addressable market, is all the demand for a type of product if one business won every customer. SAM, the serviceable addressable market, is the part of that demand your product and reach can actually serve. SOM, the serviceable obtainable market, is the slice of SAM you can realistically win in the next few years. Founders use the three figures to pitch investors, and marketers use them to set targets and choose where to spend.
Key Takeaways
- TAM is the total revenue opportunity at 100% market share.
- SAM narrows TAM by your product, location, price point and channels.
- SOM is the share of SAM you can capture soon, given competitors and budget.
- The basic formula for each ring is number of possible customers multiplied by average yearly spend.
- Bottom-up estimates built from real prices and customer counts are more trusted than top-down industry reports.
What Do TAM, SAM and SOM Mean?
Think of three rings, one inside the other. The outer ring is everyone who could ever buy what you sell. The middle ring is the customers you could serve today. The inner ring is the customers you can expect to win.
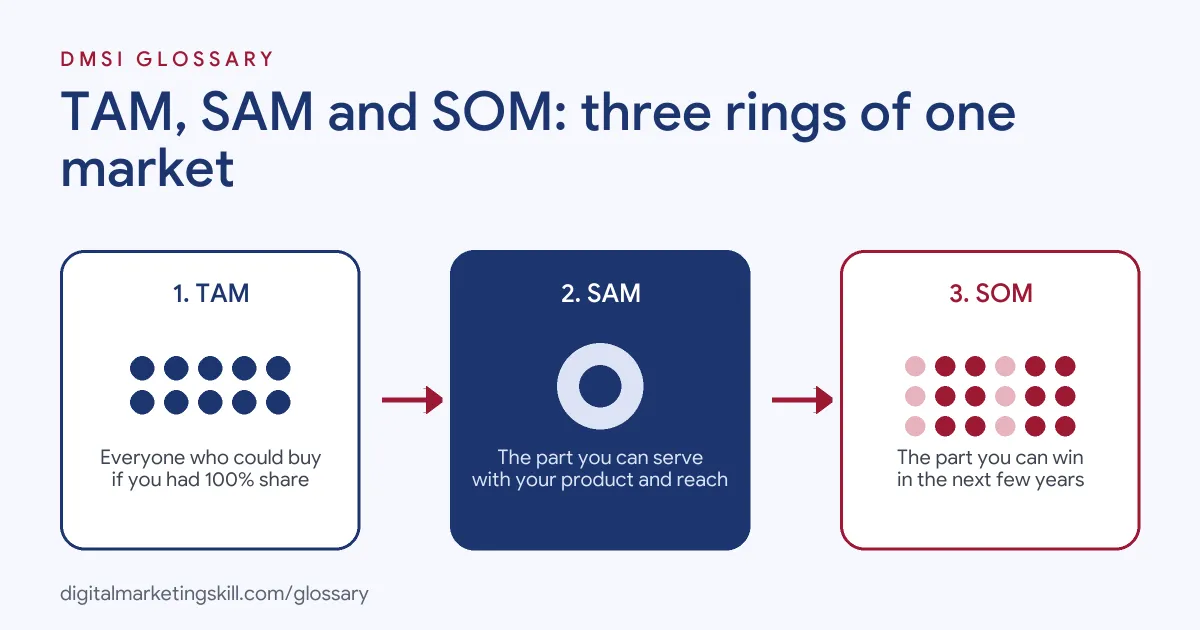
TAM: Total Addressable Market
Salesforce describes TAM as the total number of customers who could possibly use a product, or the total revenue that market represents. You will also see it called total available market. TAM ignores your limits. It assumes perfect reach, no rivals and every buyer choosing you. That is why TAM shows the size of the opportunity, not a forecast.
SAM: Serviceable Addressable Market
SAM is the part of TAM that fits your business model. Some sources call it the serviceable available market, but the meaning is the same. You narrow TAM by real limits: the countries you sell in, the language of your product, your price, the customer type you target and the channels you can use. If you only sell in the UK, global demand belongs in TAM, not SAM.
SOM: Serviceable Obtainable Market
SOM is the share of SAM you can realistically win within a set time, often three to five years. It takes account of competitors, your marketing budget, your sales team and how fast customers switch. SOM is the number most useful for revenue plans and short-term marketing targets.
How to Calculate TAM, SAM and SOM
The core formula is simple: number of potential customers × average yearly revenue per customer. You apply it three times, narrowing the customer count each time.
| Measure | Customer count to use | Formula |
|---|---|---|
| TAM | Every possible buyer of this type of product | All potential customers × average yearly spend |
| SAM | Buyers who match your location, product and price | Serviceable customers × average yearly spend |
| SOM | Buyers you can win given rivals and resources | SAM × realistic market share |
Top-Down vs Bottom-Up
There are two main ways to find the numbers. A top-down estimate starts from a big industry figure, such as a published market report, and cuts it down by percentages. It is fast but often too rosy, because the percentages are guesses. A bottom-up estimate starts from your own data: real prices, real customer counts from public registers or directories, and your actual conversion rates. It takes longer but is much easier to defend, so investors and managers tend to trust it more.
A third option, sometimes called value theory, estimates how much value your product creates for each customer and how much of that they would pay. It suits brand-new product types where no market data exists yet.
Where to Find the Numbers
Good market sizing depends on good inputs. Here are practical places to look for each part of the formula:
- Customer counts: Government business registers and census data, trade association member lists, and online directories such as Google Maps listings for a category in a city.
- Spend per customer: Your own prices, competitors’ public price pages and, for consumer products, national household spending surveys.
- Demand signals: Keyword search volumes and Google Trends show how many people look for the problem you solve and whether interest is growing.
- Competitor share: Review counts, social followings and job ads hint at how large rivals are, which helps you judge a realistic SOM.
- Your own data: Website conversion rates, trial-to-paid rates and average order value turn SOM into a monthly target.
Write down each source next to the number you used. If a manager or investor questions a figure, you can show exactly where it came from, and you can update it easily when better data arrives.
Worked Example
Here is a made-up example using round numbers. A start-up sells a social media scheduling app for restaurants at £600 a year.
- TAM: Suppose there are 100,000 restaurants in the UK. At £600 each, TAM is £60 million a year.
- SAM: The app only works in English, needs an Instagram account and suits independent restaurants, not big chains. Say 30,000 restaurants fit. SAM is 30,000 × £600 = £18 million.
- SOM: There are already several rival tools, and the team has a small ad budget. Winning 3% of SAM in three years seems realistic. SOM is 900 restaurants, or £540,000 a year.
The SOM figure is the one the marketing team plans around. For example, 900 customers over three years means about 25 new customers a month. If the free trial converts at 10%, the team needs around 250 trials a month. That gives a clear target for ads, content and email.
Why TAM, SAM and SOM Matter for Marketers
- Realistic targets. SOM turns a vague hope into a lead or sales target you can split by month and channel.
- Budget choices. If SAM in one country is three times bigger than in another, that guides where your ad spend goes first.
- Clear audiences. The filters you use to narrow TAM into SAM are, in effect, your target audience definition.
- Launch planning. A go-to-market strategy starts with knowing which part of the market to win first.
- Investor pitches. Most start-up pitch decks include the three rings, and a clear bottom-up SOM builds trust.
Common Mistakes to Avoid
- Using a giant TAM to impress. Quoting “the global marketing industry” for a niche tool makes the whole estimate look careless.
- Mixing customers and users. Count the people or businesses who pay, not everyone who might use the product.
- Skipping competitors. SOM must reflect how much rivals already hold. A quick competitor analysis helps.
- Treating SOM as a promise. It is an estimate. Review it as real conversion data comes in.
- Hiding the maths. Always show the customer counts and prices you used, so others can check them.
Where You’ll Use TAM, SAM and SOM at Work
Market sizing appears in product marketing and strategy roles. One remote director of product marketing role asks the hire to “perform Total Addressable Market (TAM) analysis” for target segments. Another strategy role mentions “Serviceable Obtainable Market (SOM) analyses to evaluate new geographies”.
Even in junior marketing jobs, the idea helps. When a manager asks how many leads a campaign could bring, you can work from the size of the reachable market rather than guessing.
Learn It in the Full Stack Track
Market sizing and planning span every channel, so the best fit is the Full Stack option, which covers all four tracks. You take all ten courses, starting with AI fundamentals for strategy and planning, and complete one portfolio project from each track. You also work on a U.S. Project Internship from day one, with unlimited 1-on-1 mentoring.
Next, read our small business marketing plan guide. You may also like our glossary entries on market research, segmentation and SMART objectives.
Frequently Asked Questions
What does TAM SAM SOM stand for?
Total addressable market, serviceable addressable market and serviceable obtainable market. They describe a market from its full size down to the share you can win.
What is the serviceable addressable market?
It is the part of the total market that your product, price, location and channels can actually serve. It is also called the serviceable available market.
How do you calculate TAM?
Multiply the number of all potential customers by the average amount each one would spend in a year.
What is a realistic SOM percentage?
It depends on the market and competition. New businesses often assume a low single-digit share of SAM in the first few years, then adjust as real data arrives.
Should I use top-down or bottom-up market sizing?
Bottom-up is usually better, because it uses real prices and customer counts. Use top-down figures only as a quick cross-check.
Why do investors ask for TAM, SAM and SOM?
They show how big the opportunity is and whether the founders have a realistic plan to win part of it.
Is TAM the same as market size?
They are close but not identical. Market size often describes current sales in an industry, while TAM describes the full demand your type of product could serve, including customers not buying yet. Use whichever term your reader expects, but always explain how you counted.
Sources: Salesforce: What is total addressable market; HubSpot: TAM, SAM and SOM; Shopify: Total addressable market; The Motley Fool: Total addressable market; remote job listings on Himalayas and Himalayas.