Facebook ad strategies fail most often for a boring reason: the targeting, the creative and the landing page each do their job alone instead of together. Meta has disclosed more than 10 million active advertisers on its platforms, so a small budget needs every part aligned. This guide shows what to fix, in what order, and how to measure it.
Key Takeaways
- Scale works against small budgets. Meta has disclosed more than 10 million active advertisers competing for the same audiences, so generic facebook ad strategies get outbid fast.
- Clicks are getting harder to earn, but cheaper to buy. WordStream’s latest benchmark study of over 1,000 US accounts found the average Facebook traffic-campaign click-through rate is 1.93%. That is up 12.87% year over year. The average cost per click fell to $0.60 over the same period.
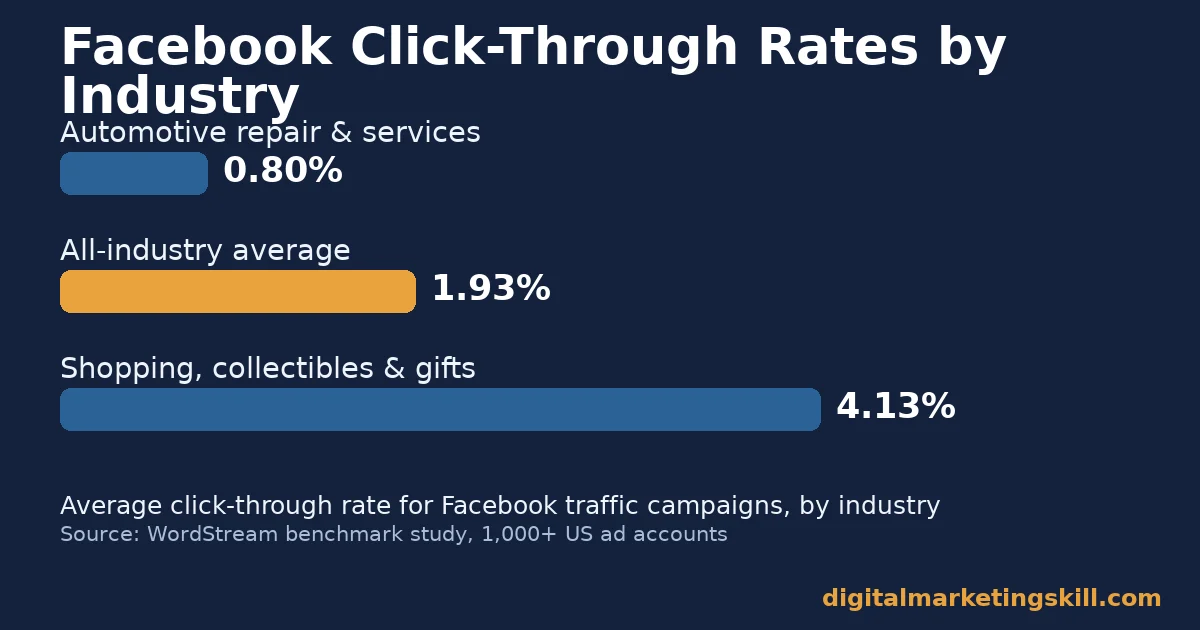
- Industry gaps are large. The same WordStream study found click-through rates ranging from about 0.80% in automotive repair and services to 4.13% in shopping, collectibles and gifts.
- The landing page decides the ad’s value. Unbounce’s Conversion Benchmark Report, built from more than 57 million conversions across 41,000 landing pages, found a median conversion rate of 6.6%, with ecommerce pages converting at a 4.2% median.
- Alignment beats any single tactic. A real Facebook ads case for a small puzzle brand reached a 9.68x return on ad spend only after targeting, creative and landing copy were unified around one message.
In this guide
- What Most Facebook Ad Strategies Advice Skips
- How Facebook Ad Strategies Actually Work
- What Differs Between Weak and Strong Facebook Ad Strategies
- How to Fix Each Part of Your Facebook Ad Strategies
- How to Measure Facebook Ad Strategies
- The One Decision Rule: Fix the Weakest Link First
- A Real Case: A Small Puzzle Brand’s 9.68x Return
- Frequently Asked Questions About Facebook Ad Strategies
- Start With Your Weakest Link
What Most Facebook Ad Strategies Advice Skips
Most articles on facebook ad strategies list tactics: better targeting, better images, a sense of urgency in the copy. None of that is wrong, but it treats each tactic as if it works in isolation. A sharp audience with a flat image still underperforms. A great image sent to the wrong landing page still loses the sale.
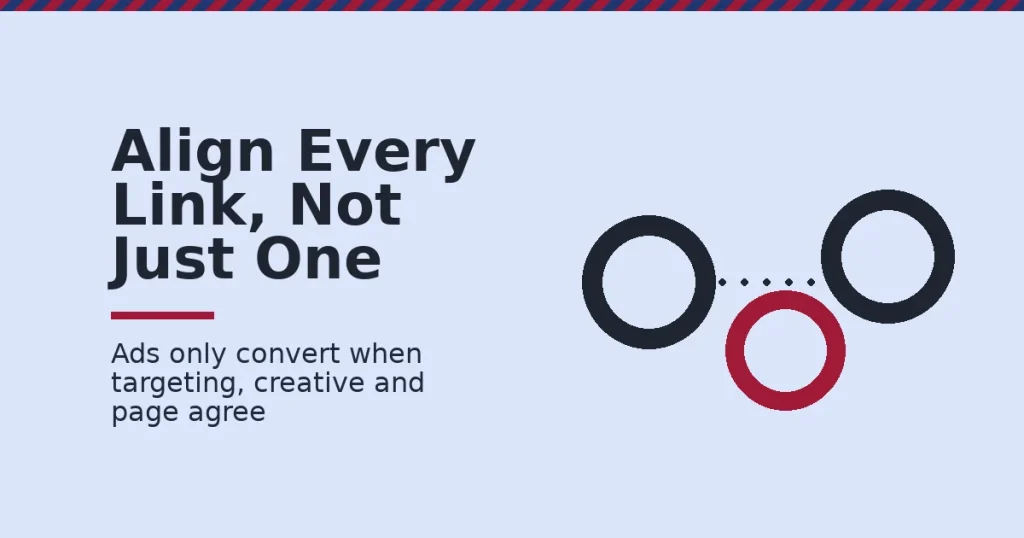
This guide treats facebook ad strategies as one system with three connected parts: who you target, what you show them, and where they land. It names the gap first. Then it explains the auction mechanism, shows what to change in each part, and how to tell whether the change worked.
A few ground rules before the detail. The industry figures below come from WordStream’s own advertiser accounts and Unbounce’s aggregated landing page data. Read them as a snapshot from two companies’ customer bases, not a universal law. The real case near the end is one agency’s reported result during a demand spike. Treat it as an informed data point, not a promise of similar results for every business.
How Facebook Ad Strategies Actually Work
Every Facebook ad strategy ultimately runs through the same mechanism: an auction that is won on more than price. Understanding that auction changes how you plan targeting, creative and budget.
The Auction Behind Every Facebook Ad
When an eligible person scrolls into a placement, every advertiser whose targeting matches that person enters a mini-auction. Meta does not simply award the slot to the highest bidder. Instead, Meta’s own ad auction guidance says it scores each ad on three things: the advertiser’s bid, the ad’s estimated action rate, and its estimated quality. The action rate is how likely that specific person is to act on the ad. The ad with the highest total value wins. That is why a cheap bid with strong creative can beat a bigger budget with a weak ad.
This matters most for a small business. A large advertiser can absorb a weak ad with sheer budget. A small business usually cannot, so every one of its facebook ad strategies has to earn its place in the auction on relevance, not just on spend.
This is also why cost per click moves with relevance, not just competition. WordStream’s data put the average Facebook cost per click for traffic campaigns at $0.60, down 14.29% from the year before, even while click-through rates rose. You can check your own ad’s standing with Meta’s ad relevance diagnostics. They rank quality, engagement and conversion rate against ads competing for the same audience.
The Three Parts a Strategy Must Align
Because the auction rewards relevance to a specific person, a strategy only works when three parts point at the same person and the same promise:
- Targeting decides who sees the ad and how cheaply you can reach them.
- Creative decides whether that person stops scrolling and understands the offer in the first two seconds.
- Landing page decides whether the click becomes a lead, a sale or a wasted cost per click.
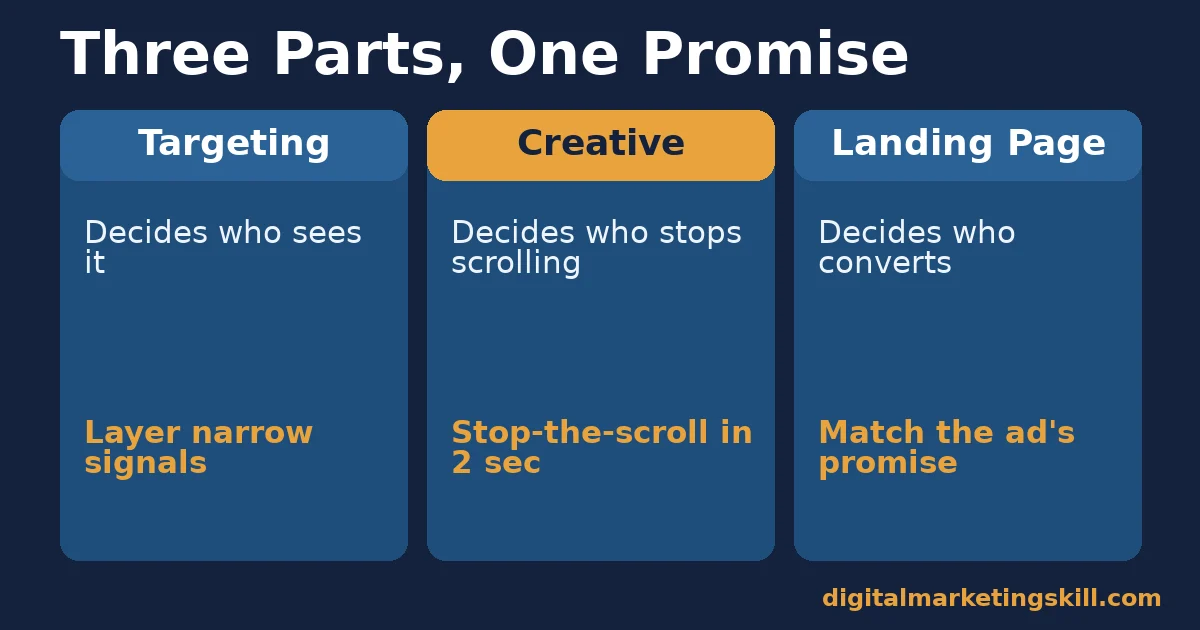
Weak facebook ad strategies usually fail at the seam between two of these parts, not inside any one of them. This is the same seam that breaks a sales funnel further down, so fixing it here pays off twice. The next two sections walk through what differs between a weak and a strong version of each part. After that, they show how to fix the one that is holding you back right now.
What Differs Between Weak and Strong Facebook Ad Strategies
The three parts below are paired with their fix later in this guide. Read this section to diagnose where your current campaign is weakest before you change anything.
Targeting: Built on Audience Signals
Weak targeting relies on one broad signal, such as an age range and a country. It expects the algorithm to sort out the rest. Strong targeting layers signals instead: location, demographics, interests, behaviours and, where available, existing customer data fed back as a lookalike source.
Meta’s own ad guidance groups targeting into location, demographics, interests and behaviours. It also offers connection-based options that include or exclude people already linked to your Page. A small business that sells a niche product narrows by interest signals tied to that niche, rather than a wide demographic bracket alone.
Creative: Built to Earn Attention, Not Just Impressions
Weak creative treats the ad image or video as decoration for the offer. Strong creative treats the first two seconds as the whole job: stop the scroll, then hand off cleanly to the copy. Text-heavy images and generic stock photography both struggle here. They look like every other ad in the feed, not like a post from a person a viewer follows.
Video has its own version of this test. A viewer decides whether to keep watching almost immediately. The opening frames carry the weight, so the most compelling proof of the product or service has to appear first, not after a slow build-up. The same stop-the-scroll logic applies to building brand awareness with paid reach, not just direct sales.
Landing Page: Built to Match the Promise
Weak landing pages send every ad to the same homepage or general shop page. That forces the visitor to re-find what the ad promised. Strong landing pages repeat the ad’s headline, image style and offer. The visitor feels they have arrived in the right place within the first screen.
Unbounce’s Conversion Benchmark Report is drawn from more than 57 million conversions across roughly 41,000 landing pages. It found a median conversion rate of 6.6% across industries, with ecommerce landing pages converting at a 4.2% median and SaaS pages at 3.8%. The gap between a strong and a weak landing page is often larger than the gap between a strong and a weak ad.
How to Fix Each Part of Your Facebook Ad Strategies
These three fixes mirror the three parts above. Apply the one that matches your weakest link first, because fixing an already-strong part rarely moves the numbers.
Targeting: Lead With Layered, Narrow Signals
Start narrow with one clear interest or behaviour signal that matches your actual buyer, then widen only if the cost per result rises above what you can afford. If you have past customers, build a lookalike audience from your highest-value segment rather than your entire list. A narrower seed usually produces a more precise match.
Review the connection settings too. Excluding people who already purchased, unless you are running a repeat-purchase campaign, stops you from paying to re-sell something already sold.
Creative: Lead With Native-Feeling Content
Film or photograph the product being used the way a real customer would use it. Shoot it in the format your audience already scrolls through, not as a staged studio shot. Keep on-image text short too. An image crowded with text competes with your own headline for attention, instead of supporting it.
Test more than one creative at a time, but change only one variable per test, such as the opening frame or the first line of copy, so you can tell which change moved the click-through rate.
Landing Page: Lead With Message Match
Match the landing page headline to the ad’s headline, word for word where possible, and keep the same hero image style. A visitor should be able to tell within two seconds that the page continues the ad they clicked, not a different conversation. Our guide to landing page examples that actually drive conversions breaks down what a strong message-matched page includes.
Remove every link that is not the one conversion action you want. A full site navigation menu gives a paid visitor an easy way to wander off before converting. That quietly raises your real cost per result, even if your cost per click looks fine.
How to Measure Facebook Ad Strategies
Judge facebook ad strategies on a short chain of metrics, each defined in one sentence, so you can tell which part of the chain is weak. If you also run paid search, our guide to PPC ads uses many of the same metrics.
Six Metrics Defined
- Click-through rate (CTR). The share of people who saw the ad and clicked it. WordStream’s data puts the all-industry traffic-campaign average at 1.93%, so compare your number against that baseline, not zero.
- Cost per click (CPC). What you pay, on average, for each click. The all-industry average for traffic campaigns was $0.60, though Finance & Insurance ran as high as $0.86.
- Cost per mille (CPM). What you pay for every 1,000 impressions. It rises when more advertisers compete for the same audience, so a sudden CPM increase often signals rising competition, not a problem with your ad.
- Landing page conversion rate. The share of clicks that complete your goal action. Unbounce’s benchmark data puts the cross-industry median at 6.6%, a useful line to measure your own page against.
- Cost per result. Total spend divided by completed goal actions. This is the number that actually tells you whether the campaign is profitable, more than CTR or CPC alone.
- Return on ad spend (ROAS). Revenue generated for every unit of ad spend. The real case later in this guide reported a 9.68x figure: $9.68 back for every $1 spent, in a short, demand-driven window.
Reading Them Together
Read these metrics as a chain, not a scoreboard. A low CTR against the 1.93% baseline usually means weak creative or mismatched targeting. A reasonable CTR with a weak landing page conversion rate against the 6.6% benchmark usually means the ad and the page are not telling the same story. And a fine conversion rate with a loss on cost per result usually means the offer itself, or the price point, needs attention rather than the ad.
Check these numbers weekly while a campaign is new, then monthly once it stabilises, and always compare a change against the four weeks before it, not against a single best day.
The One Decision Rule: Fix the Weakest Link First
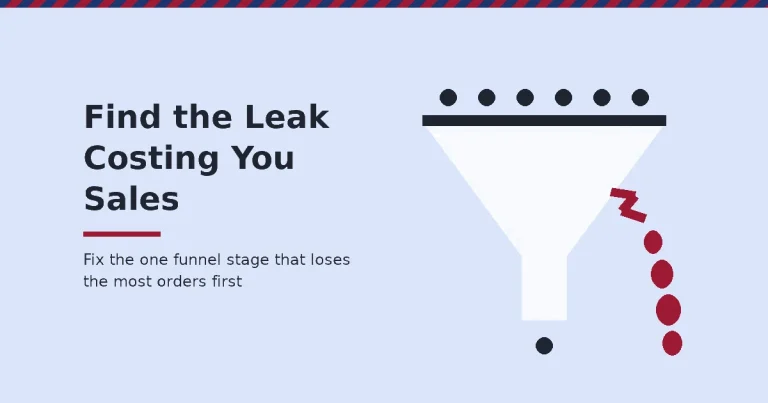
If you remember a single rule from this guide, make it this one: find the weakest of the three parts — targeting, creative, landing page — and fix only that one before touching the others. Changing two parts at once makes it impossible to know which change produced the result.
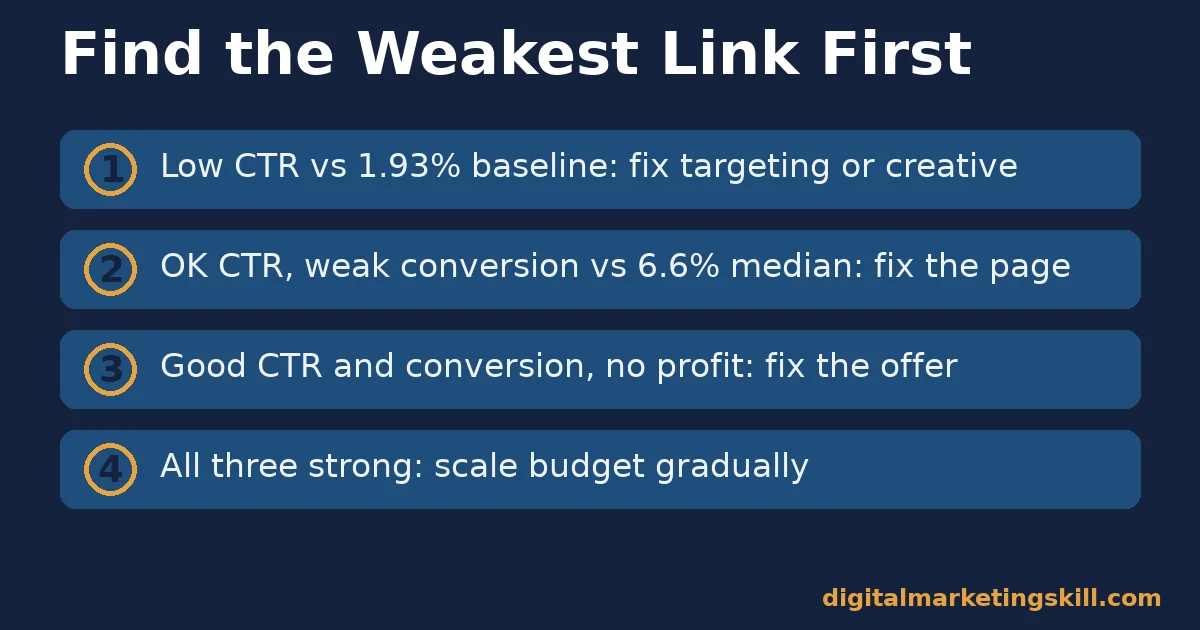
Here is an illustrative example, with invented numbers. A small home-goods shop runs an ad with a 2.1% click-through rate, above the 1.93% baseline. Its landing page converts at only 1.4%, well under the 6.6% median. The owner leaves the ad untouched. They rewrite the landing page to match the ad’s headline and remove the site navigation. Conversion rate rises to 4.9% over the next month, with no change in ad spend or targeting.
The lesson is about sequencing. Because the ad was already working, every extra dollar spent on new creative would have been wasted while the real leak stayed in the landing page.
A Real Case: A Small Puzzle Brand’s 9.68x Return
Seltzer Goods, a small brand selling artist-designed jigsaw puzzles, ran a 30-day Facebook ad campaign during a sharp, pandemic-driven spike in demand for indoor activities, as documented by the agency that managed it. The campaign combined cold-audience targeting, built on a “see, think, do” framework, with lookalike audiences built from site visitors, cart-adders and past buyers. It paired that with bright, consistent puzzle photography and a single unified message across every ad and landing page.
The reported results were a 9.68x return on ad spend and a 785% increase in monthly revenue. Cost per customer acquisition came to $4.87. Paid social was responsible for about a quarter of the total revenue gain; the rest came from a lift in organic and direct traffic.
Read the limits alongside the result. This was a short window during an unusually strong demand spike. It is reported by the agency that ran the campaign, not an independent auditor. Jigsaw puzzles are also a low-consideration, visual product that is unusually easy to show well in a single image. Treat it as a model for aligning targeting, creative and message, not a forecast for every category.
Frequently Asked Questions About Facebook Ad Strategies
What is the most important part of facebook ad strategies for a small business?
None of the three parts works alone, but the landing page is the most commonly neglected. Unbounce’s benchmark data shows a 6.6% median conversion rate is achievable, yet many small business ads still point at a general homepage that was never built to match the ad’s promise.
How much should a small business expect to pay per click on Facebook?
WordStream’s analysis of over 1,000 US accounts found an average of $0.60 per click for traffic campaigns. Treat that figure as a starting baseline, not a guarantee. Your own audience and creative quality will move it up or down.
How do I choose a target audience for Facebook ads?
Start from the specific need your product solves, then layer location, demographic and interest signals that match the person who has that need, rather than targeting the broadest group that could plausibly buy.
Why is my Facebook ad getting clicks but no sales?
This usually means the landing page is not continuing the ad’s message. Check that the headline, image style and offer on the page match what the person clicked, and remove distracting navigation links from the page.
How long should I run a Facebook ad before judging the result?
Most small campaigns need at least a full week, and ideally several weeks, before the auction has enough data to stabilise cost per result. Judging a campaign after a single day of spend usually leads to the wrong conclusion.
Is video or image creative better for small business Facebook ads?
Neither format wins universally. What matters is whether the opening two seconds, of either format, earns attention and matches what the targeted audience already expects to see in their feed.
Should I boost a post instead of running a proper ad campaign?
Boosting a post is a quick way to extend reach, but it skips most of the targeting and landing-page controls a full campaign gives you. Use a proper ads-manager campaign whenever the goal is leads or sales, and save boosting for simple visibility on an organic post that is already performing well.
What budget do I need to test facebook ad strategies properly?
There is no fixed minimum, but a test needs enough spend to clear a few hundred impressions per ad variation so the auction has data to judge it on. A small business can often learn enough from a modest daily budget run over one to two weeks, provided only one variable changes at a time.
Do Facebook ad strategies work the same worldwide?
The mechanism is consistent everywhere Meta operates ads: an auction scored on bid, estimated action rate and quality. But costs, competition and audience behaviour vary by market. Treat every benchmark in this guide as a starting point, and test it against your own results in your country.
Start With Your Weakest Link
Facebook ad strategies improve fastest when you diagnose before you spend more. Pull your last campaign’s click-through rate, cost per click and landing page conversion rate. Compare each against the benchmarks in this guide, then fix only the weakest of the three before changing anything else. Revisit the same three numbers after a few weeks, not after a single day, so the auction has time to settle.
If you want structured, hands-on practice with campaign strategy, targeting and creative testing, Digital Marketing Skill Institute‘s Master Diploma in Digital & AI Marketing is built around four AI-powered tracks, including an AI-Powered Social Media Management and Advertising track, drawn from ten execution-first courses in total, with a Full Stack option for completing all four tracks. It includes unlimited 1-on-1 coaching and mentoring and a U.S. Project Internship with a verified U.S. Work Reference Letter, and the diploma is dual US and UK accredited and recognised in more than 100 countries.
The programme is 100% online, so you can study and apply these facebook ad strategies from anywhere in your country. Explore more guides on the Digital Marketing Skill Institute blog, browse student reviews, and when you are ready, apply for the Master Diploma or start from the Digital Marketing Skill Institute homepage.
Every figure in this guide was checked against its original source before publication. Figures marked as illustrative are invented examples, not real results.