
Landing page optimization is the process of removing friction and matching a page to why a visitor arrived. Do that well and more visitors complete the one action you want. Most pages lose visitors in the first screen, before any headline tweak can help. This guide shows what to fix first, in what order, and how to measure whether it worked.
Key Takeaways
- Most pages underperform the benchmark. Unbounce’s analysis of over 41,000 landing pages and 464 million visitors found a median conversion rate of 6.6%. Industry medians range from 3.8% to 12.3%.
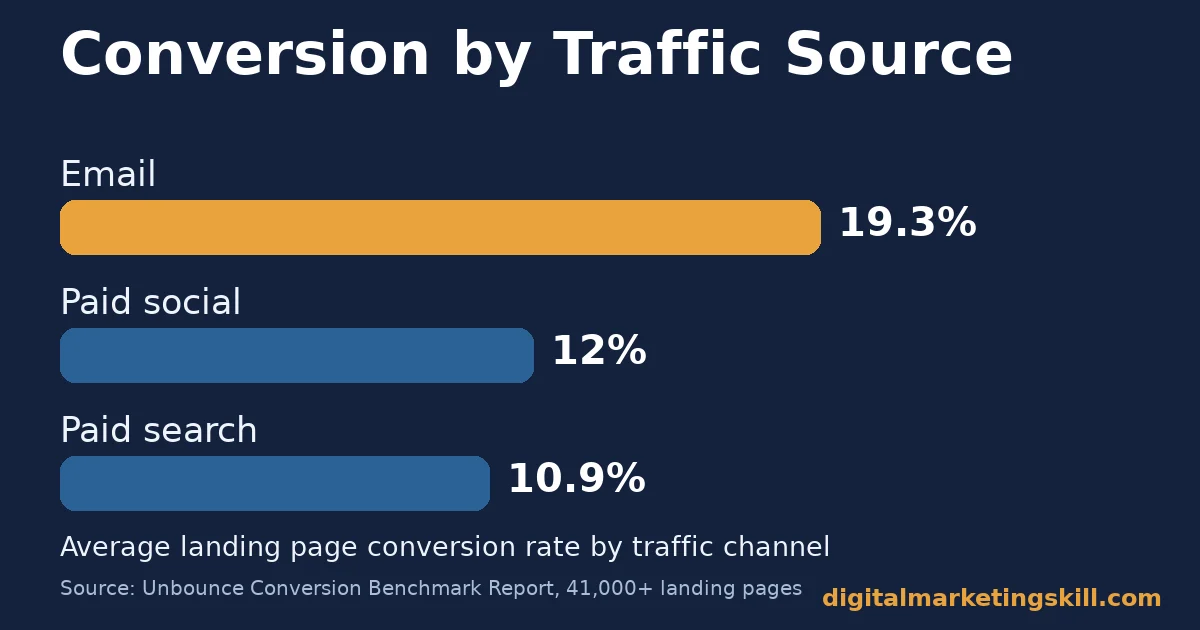
- The traffic source changes what “good” looks like. In the same Unbounce dataset, email-driven visitors converted at 19.3% on average. Paid social converted at 12% and paid search at 10.9%.
- Fewer links, not more persuasion, often wins first. Unbounce’s review of 18,639 landing pages found single-CTA-link pages averaging 13.5% conversion. Pages with five or more links averaged 10.5%.
- Form design has an outsized effect. Nielsen Norman Group found forms built to usability guidelines achieved 78% one-try submission success. Forms that ignored those guidelines achieved only 42%.
- Attention stays near the top. Nielsen Norman Group’s eye-tracking research found 57% of page-viewing time happens above the fold. 74% happens within the first two screenfuls.
In this guide
- What Most Landing Page Optimization Advice Gets Wrong
- How a Landing Page Actually Converts
- What Differs by Traffic Source
- How to Fix Each Traffic Source for Conversion
- A Landing Page Optimization Checklist, in Priority Order
- Common Mistakes That Undo Good Landing Page Optimization Work
- How to Measure Landing Page Optimization
- The One Rule: Cut Friction Before You Add Persuasion
- A Real Case: Three Words and a 104% Jump
- Frequently Asked Questions About Landing Page Optimization
- Start With Your Highest-Traffic Page
What Most Landing Page Optimization Advice Gets Wrong
Most landing page optimization checklists read the same way. Add urgency, add testimonials, add a bigger button. None of that is wrong. But it skips the order of operations. A page that is confusing or slow loses visitors before persuasion gets a chance to work.
This guide treats landing page optimization as friction removal first. Persuasion comes second. Measurement runs throughout. Here are the ground rules. The Unbounce Conversion Benchmark Report figures are one company’s platform data, not a universal law. Read them as a snapshot, not a fixed target for your exact page.
The Going.com case later in this guide describes one test’s result, not a guarantee for every page. Treat every benchmark here the same way, and re-check your own numbers before changing anything.
How a Landing Page Actually Converts
A visitor’s decision happens in roughly four steps. First, they judge whether the page matches what they expected. Next, they look for the specific action available to them. Then they weigh whether that action feels safe and worth the effort. Finally, they act or leave. Landing page optimization is the practice of making each step easier.
The first step depends on message match. Does the headline mirror the ad, email or search result the visitor just clicked? The second depends on clarity. Is there one obvious next action, not several competing ones?
The third depends on friction and trust: how many fields, how much doubt, how slow the page feels. The fourth is the only step a conversion rate actually measures. But it is the output of the other three.
Attention is also limited and front-loaded. Nielsen Norman Group’s eye-tracking research on scrolling and attention found that users spent 57% of their page-viewing time above the fold. 74% fell within the first two screenfuls. That means the headline, the core offer and the primary call-to-action carry most of the weight. The content further down the page matters less than most teams assume.
What Differs by Traffic Source
Not every landing page visitor arrives the same way. The Unbounce benchmark data shows the gap is large. A page optimized for one traffic source, without adjustment, often underperforms for another, even with identical content below the fold.
Paid Search Visitors: Built for a Fast Match
Someone who clicked a paid search ad typed their need into a search box seconds earlier. They compare your page against the memory of that query. They also compare it against whichever other result they almost clicked instead. Unbounce’s benchmark data puts the average paid search conversion rate at 10.9%, the lowest of the three major channels it tracks.
Paid Social Visitors: Built for a Hook Payoff
Paid social visitors were not searching for anything. An ad interrupted a feed and made a promise. They clicked out of curiosity more than intent. That makes the gap between the ad’s promise and the page’s opening especially costly. In the same Unbounce data, paid social converts at 12% on average, a little ahead of paid search but still well below email.
Email and Organic Visitors: Built on Existing Trust
Visitors who click through from an email you sent arrive with trust already partly earned. The same goes for a search result where your brand is already known. Unbounce found email-driven traffic converting at 19.3% on average, more than any other channel it measured.
That gap is not really about the landing page at all. It is about how much selling the page still has to do on arrival. Our guide to lead generation, qualifying and responding fast covers how that trust gets built before the click.
How to Fix Each Traffic Source for Conversion
The fixes below mirror the three visitor types above. Start with whichever source sends you the most traffic today. A fix there moves the most visitors.
Paid Search Visitors: Lead With the Exact Match
Repeat the exact phrase from the ad headline in the landing page’s own headline. Do it in the first sentence if possible. Strip the page down to the one offer the ad promised. A paid search visitor who lands on a general page with five possible next steps assumes they clicked the wrong result, and leaves.
Paid Social Visitors: Lead With the Promise You Made
Write the ad after the landing page is finished. Pull the hook directly from the page’s strongest point, so the two never drift apart. Keep the opening light: one short paragraph, one supporting image, and the primary action visible without scrolling. A curious visitor who has to work to find the payoff returns to their feed instead.
Email and Organic Visitors: Lead With a Low-Friction Form
Because trust is already present, the main barrier left is friction in the form itself. Nielsen Norman Group’s research on web form design found that usability-guided forms achieve 78% one-try submission success. Forms that break those guidelines achieve only 42%, mainly by asking for information the next step does not need.
Cut every field you do not strictly need before launch. Only add a field back if you can name the specific decision it supports.
A Landing Page Optimization Checklist, in Priority Order
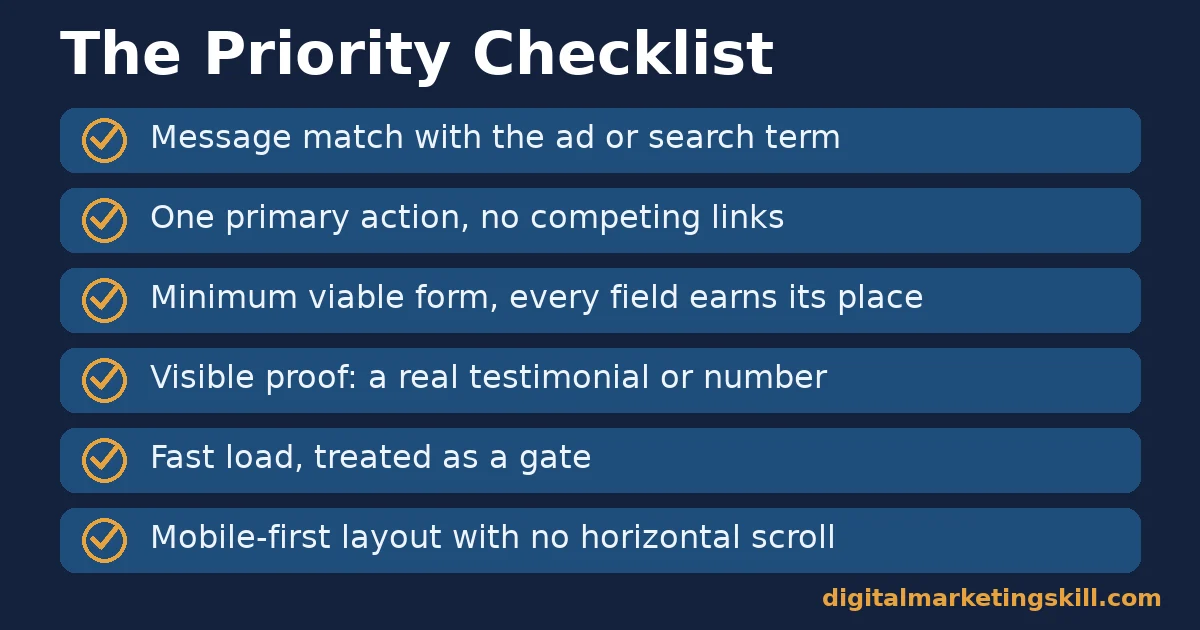
Work through these in order rather than all at once. Each item removes a specific kind of friction. The earlier ones tend to matter more, because they affect every visitor, not just the ones who make it further down the page.
- Message match. The headline mirrors the ad, email subject or search phrase that brought the visitor, word for word where possible.
- One primary action. Unbounce’s review of 18,639 pages found single-CTA-link pages averaging 13.5% conversion, against 10.5% for pages with five or more links. Remove navigation and competing links from the page.
- Minimum viable form. Every field earns its place or gets removed. Each additional field is a new reason to abandon.
- Visible proof. A real testimonial, a named case, or a specific number near the action, not a vague claim.
- Fast load. A page that stalls loses visitors before any of the above gets read.
- Mobile-first layout. The offer and the action must both be visible without pinching or horizontal scrolling on a phone screen, which our guide to building a mobile-friendly website covers in full.
For the paid traffic side of this checklist, our guide to setting up and scaling Facebook ad campaigns covers matching ad creative to the landing page, before you even get to the page itself.
Common Mistakes That Undo Good Landing Page Optimization Work
Even teams that know the checklist above still lose conversions to a handful of repeat mistakes. These show up across industries and traffic sources. Each one quietly cancels out the benefit of fixing everything else.
Treating Every Field as Free
Baymard Institute’s research on checkout flows found that the average flow contains 11.3 form fields, down from 12.7 a few years earlier. It also found that 17% of shoppers report abandoning a purchase because a checkout felt too complex.
Lead-generation forms are usually shorter than checkout flows. But the same pattern holds: each field is a small, cumulative tax on every visitor, not a one-time cost paid only by the people who finish.
Sending All Traffic to One Generic Page
A single landing page serving paid search, paid social and email traffic at once optimizes for none of them well. The three groups arrive with different expectations and different amounts of trust already earned. Splitting high-volume campaigns into source-specific variants of the same offer usually outperforms one page trying to speak to everyone. Even changing only the headline and opening line per source helps.
Burying the Offer Below the Fold
57% of page-viewing time happens above the fold, and 74% within the first two screenfuls. An offer that only appears after several scrolls competes for a shrinking share of attention. This does not mean every landing page must fit on one screen. It means the headline, the core promise and a path to the action need to be visible immediately, even if supporting detail runs longer below.
Stopping at the First Winning Test
The Going.com case later in this guide shows a single wording change producing a large reported jump. It is tempting to treat one good result as proof the page is finished.
Landing page optimization is closer to an ongoing habit than a one-time project. Traffic sources shift and competitors change their own pages. A page that converted well months ago can quietly drift below its channel benchmark, and nobody notices until the numbers are checked again.
How to Measure Landing Page Optimization
Conversion rate is the headline number, but it hides where a page is actually losing people. Track the metrics below alongside it. Each one is defined in one sentence, with a note on how to read it.
Five Metrics That Show Where a Page Loses People
- Conversion rate. Completions divided by total visitors. Compare it against your own channel average, since Unbounce’s own data shows channel medians ranging from 10.9% to 19.3%.
- Form abandonment rate. The share of visitors who start the form but never submit it. A high rate here, alongside a healthy page-level conversion rate, usually points to a specific field or step, not the whole page.
- Bounce or engagement rate. The share of visits that leave without any meaningful interaction. A high bounce rate on paid traffic usually signals a message-match failure between the ad and the page, which our guide to website traffic analysis covers in more depth.
- Page load time. How long the page takes to become usable. Treat this as a gate, not a nice-to-have. A slow page suppresses every other number on this list, which is consistent with Google’s own page experience guidance.
- Scroll depth to the primary action. The share of visitors who scroll far enough to see your call-to-action at all. This matters mainly on longer pages where the action is not visible immediately.
Reading These Numbers Together
Read them in order of where a visitor is on the page. A high bounce rate means the top of the page fails to match expectations, so fix message match first. If visitors stay but abandon the form, the form is the problem, not the headline above it.
If the form completes well but overall conversion still trails your channel benchmark, the issue is more likely traffic quality than the page.
The One Rule: Cut Friction Before You Add Persuasion
If you take one decision rule from this guide, make it this one. Before adding a testimonial, a countdown timer or a stronger headline, remove every field, link and step that is not essential to the single action you want. Persuasion added on top of unnecessary friction is wasted effort. The visitor never reaches it.
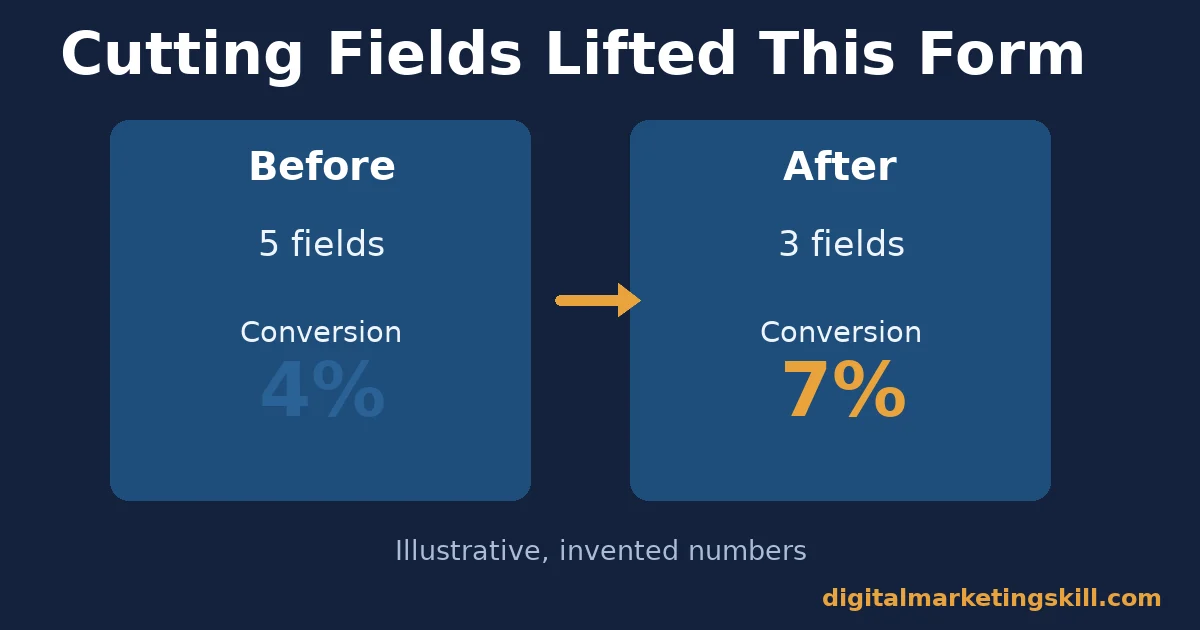
Here is an illustrative example, with invented numbers. A page asks for name, email, phone, company size and job title to download a guide, and converts at 4%. The team removes phone and job title, leaving only name, email and company size. Form starts stay the same, but completions rise, and conversion reaches 7%.
The lesson is not that three fields is always correct. It is that each field removed had been quietly taxing every single visitor, while a stronger headline would only have helped the fraction who read it closely.
A Real Case: Three Words and a 104% Jump
Going, a flight-deal service, ran an A/B test on its landing page button that changed almost nothing visually. The control button read “Sign up for free.” The variant read “Trial for free.” That shifted the framing from a limited free plan to a premium trial.
According to Unbounce’s write-up of the test, the change produced a 104% increase in conversions month-over-month. The team also reported that paid channel conversion rates surpassed organic rates for the first time afterward.
The write-up does not disclose the test’s sample size, duration or statistical significance threshold. Treat the 104% figure as one company’s reported result, not a number you can expect to repeat exactly. The underlying lesson still holds. Wording that changes what a visitor believes they are agreeing to can move a landing page optimization result more than a layout overhaul does.
What makes the case useful is not the exact percentage. It is what the team changed, and what they left alone. The layout, the images, the form and the surrounding copy all stayed the same. Only the framing of the offer shifted, from a limited free plan to something that sounded like a premium trial.
That is a cheap test to run on almost any page. It costs nothing to try before committing to a larger redesign.
Frequently Asked Questions About Landing Page Optimization
What is landing page optimization?
Landing page optimization is the ongoing process of adjusting a page’s message, layout, form and load speed. The goal is simple: more visitors complete one specific action, measured by the page’s conversion rate.
What is a good landing page conversion rate?
Unbounce’s benchmark data puts the median at 6.6% across all industries. Medians by industry range from 3.8% to 12.3%. Your own channel average is a more useful target than any single industry figure.
How many form fields should a landing page have?
As few as the next step genuinely requires. Nielsen Norman Group’s research shows forms that follow usability guidelines, asking only for essential fields, achieve far higher one-try completion rates than forms that do not.
Should a landing page have more than one call-to-action?
Generally no, if those calls-to-action point to different goals. Unbounce’s data shows single-CTA-link pages converting higher on average than pages carrying several competing links. Repeating the same button at different scroll depths is not the same as competing CTAs, though.
Does page load speed really affect conversion rate?
Yes. Slow pages suppress every later metric, because visitors leave before reading the copy or reaching the form. Load speed should be treated as a gate, not a secondary fix.
What’s the difference between a landing page and a regular website page?
A landing page is built around one action and strips out other goals and navigation. A general website page usually serves several goals at once. That is why repurposing a homepage as a campaign landing page tends to underperform.
How long should a landing page optimization test run before I trust the result?
Long enough to reach a meaningful sample for your traffic volume. Low-traffic pages need longer. Review the result against your own historical range, rather than stopping the moment a number looks favorable.
Can I reuse the same landing page for every traffic source?
You can, but it usually costs you conversions. Paid search, paid social and email visitors arrive with different expectations and different levels of trust already earned. A page tuned for one tends to underperform for the others. A duplicated page, with only the headline and opening line changed per source, is often enough to close most of the gap.
Do landing page optimization results from one test carry over to other pages?
Rarely in exact numbers, though the underlying lesson often does. The Going.com case in this guide reports a large result from a wording change. But the write-up does not disclose sample size or duration. Treat the percentage as one company’s reported outcome, and test the underlying idea on your own page rather than copying the number as a forecast.
Start With Your Highest-Traffic Page
Landing page optimization delivers the most value fastest when you start with the page already receiving the most visits. Every fix there compounds across existing traffic, rather than traffic you have yet to earn.
Run the priority checklist above against that page. Remove whatever friction you find first, and measure the five metrics for a few weeks before changing anything else. For the content side of driving qualified traffic to that page in the first place, see our guide on how to optimize a blog post for search engines.
If you want to build this skill properly, Digital Marketing Skill Institute teaches it hands-on inside the Master Diploma in Digital & AI Marketing. Its AI-Powered Lead Generation and Email Automation track covers landing pages and forms directly, as one of four AI-powered tracks totalling ten courses, with a Full Stack option for all four.
It comes with unlimited 1-on-1 coaching and mentoring, plus a U.S. Project Internship with a verified U.S. Work Reference Letter. The diploma is dual US and UK accredited, and recognised in more than 100 countries.
The programme is 100% online, so you can study and apply these skills from anywhere in your country. Browse more guides on the Digital Marketing Skill Institute blog. When you are ready, apply for the Master Diploma or start from the Digital Marketing Skill Institute homepage.
Every figure in this guide was checked against its original source before publication. Figures marked as illustrative are invented examples, not real results.
![9 Amazing Digital Marketing Skills to Make Money Online [With Proof]](https://digitalmarketingskill.com/wp-content/uploads/2019/07/9-Amazing-Digital-Marketing-Skills-to-Make-Money-Online-With-Proof-17.png)






