
Facebook ad campaigns waste budget most often when the objective, the audience size and the creative do not match. Pick the right objective. Keep the audience wide enough for the system to learn. Then give the campaign a full week before you judge the result. That one sequence fixes most underperforming Facebook ad campaigns.
Key Takeaways
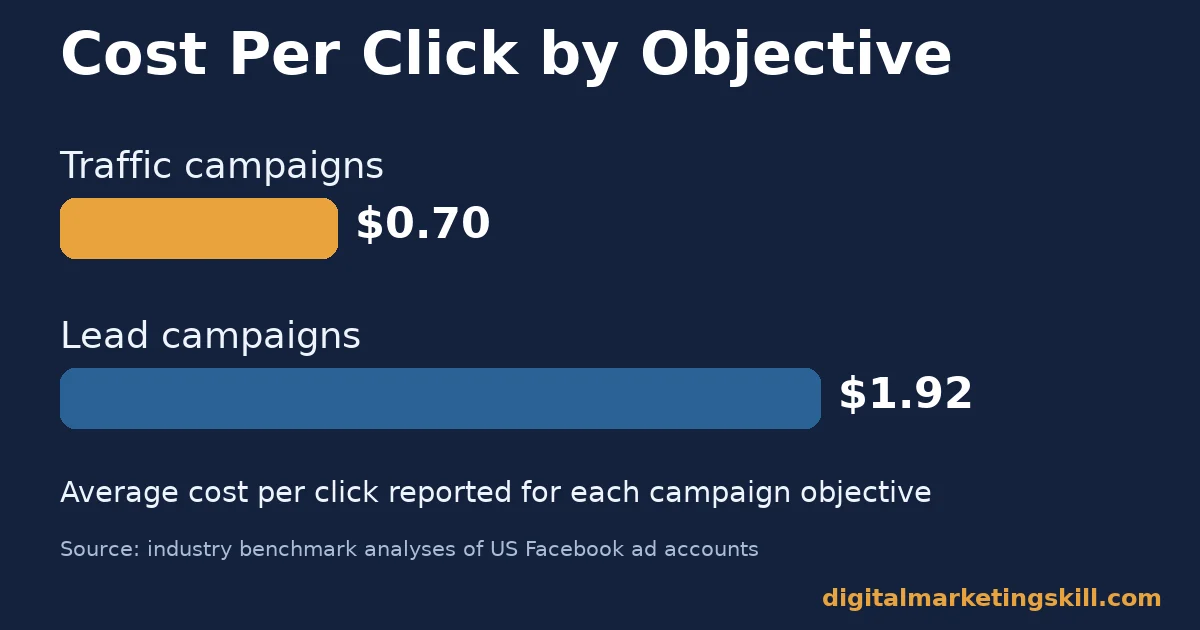
- Objective shapes cost. A recent benchmark review puts lead-generation Facebook ad campaigns at a 2.59% click-through rate and around $1.92 per click. Simple traffic campaigns average closer to $0.70.
- Audience size changes delivery. Meta’s own ad-targeting guidance recommends starting with a broad audience of 2 to 10 million people. It notes that detailed interest targeting “works best” once the resulting pool stays above roughly 2 million.
- Benchmarks vary by source. The same benchmark review warns that reports differ in objective mix, industry classification and date range. Matching your own account’s 30 to 90 day history matters more than any single published figure.
- Copy gets cut fast. An ad-specification guide found that only the first 125 characters of primary text display before a “See more” link hides the rest. Only about 40 characters of a headline are reliably visible on a phone.
- Small budgets can return real money. One real case, covered later in this guide, turned a $14 ad spend into $878 in sales. That is a single result, not a guarantee.
In this guide
- Why Most Facebook Ad Campaigns Underperform
- How Facebook Ad Campaigns Actually Get Delivered
- What Differs by Campaign Objective
- How to Lead With Each Objective
- How to Measure Facebook Ad Campaigns
- The One Decision Rule: Test With Separate Budgets, Scale With One Shared Budget
- A Real Case: Small Budget, Real Return
- Frequently Asked Questions About Facebook Ad Campaigns
- Putting Facebook Ad Campaigns to Work
Why Most Facebook Ad Campaigns Underperform
Most advice on Facebook ad campaigns jumps straight to tactics. Better images. Punchier copy. A bigger budget. Those things help, but they skip the decision that actually determines whether any of it matters: whether the campaign was built to match its own objective, as one paid media channel inside a wider plan.
This guide starts with that structural decision. From there it moves through targeting, measurement, and a single rule for scaling budget safely. Treat every public benchmark here as an informed snapshot, not a settled fact. Different reports mix different objectives, industries and time windows, so figures shift from one report to the next. Your own account’s last 30 to 90 days will always outrank an industry average.
None of this requires a large team or an agency retainer to apply. The mechanics below are the same whether you are running your first $20-a-day test or managing a six-figure monthly budget; only the scale of the numbers changes, not the underlying logic of how Facebook decides who sees an ad and when a campaign is ready to be judged.
How Facebook Ad Campaigns Actually Get Delivered
Facebook remains the largest social platform by reach. Sprout Social reports 3.07 billion monthly active users worldwide. Every Facebook ad campaign competes for attention inside that pool through the same two mechanics, no matter the objective: an auction that decides who sees the ad, and a learning phase that decides how fast the system finds the right people.
The Auction Decides Who Sees Your Ad
Facebook does not simply show ads to the highest bidder. Every time someone opens the app, the platform runs a fresh auction among the ads eligible for that person. It ranks them on a mix of your bid, the estimated action rate and ad quality. A cheap bid with weak estimated quality can lose to a pricier one the system expects people to respond to.
That is why two advertisers targeting the same audience can pay very different prices. The one with a more relevant ad, a clearer match between creative and audience, and a healthier quality score simply wins more auctions at a lower cost. Facebook ad campaigns reward relevance before they reward budget size.
In practice, “estimated action rate” is Facebook’s own prediction of how likely a specific person is to take the action your objective is optimising for, based on how similar people have behaved before. So a weak estimated action rate is rarely fixed by raising the bid alone. Instead, it usually points back to a mismatch between the audience you chose and the offer the ad is making.
The Learning Phase Needs Volume, Not Time
After launch, a campaign enters a learning phase while the delivery system gathers data to optimise. This phase ends on results, not on a calendar. It needs a flow of actions, not simply days on the clock. A campaign that is too small, too narrow or changed too often never collects enough signal to exit learning, so it stays expensive.
Every edit that changes targeting, creative or budget by a large step can restart this phase. That single fact explains why campaigns tweaked daily often perform worse than ones left alone for a full week. Patience, not constant tinkering, is what moves most Facebook ad campaigns out of their most expensive early days.
What Differs by Campaign Objective
Facebook groups its campaign objectives around what you want someone to do after seeing the ad: visit a page, hand over contact details, or buy something. Each objective optimises delivery differently inside Facebook Ads Manager. The same budget and creative can produce very different results depending on which one you pick.
Traffic Campaigns: Built for Early Signal
Traffic campaigns optimise for link clicks. Facebook shows the ad to people statistically likely to click it. An industry benchmark analysis put the average click-through rate for traffic campaigns at 1.71%, with an average cost per click near $0.70 across industries. The same report expects that cost to drift toward $0.78 as auction competition increases.
A click is a cheap, common action, so traffic campaigns are the fastest way to get an early read on a new audience or a new piece of creative. They are built for signal, not revenue. Judge them on cost per click and the quality of who lands on the page, not on sales.
Lead Campaigns: Built for Qualified Contacts
Lead campaigns optimise for a completed contact form, either in an instant on-platform form or on your own landing page. Sprout Social’s marketer report puts the average click-through rate for lead campaigns at 2.59%, with a cost per click around $1.92. Both numbers run higher than traffic campaigns because the action being optimised for is rarer, and worth more.
Lead campaigns are built to filter, not just attract. A well-built lead form asks only for what the next step genuinely needs, because every extra field reduces completions. The objective rewards a tight match between the audience and the offer more than it rewards a clever headline.
Sales Campaigns: Built for Revenue per Click
Sales, or conversion, campaigns optimise for a purchase or another value event tracked through the Meta Pixel or Conversions API. Delivery leans toward people who resemble your past buyers. That is why these campaigns usually need existing purchase data, a pixel with enough events, or a tested custom audience to work well from day one.
Sales campaigns are built around revenue per click, not clicks themselves. A campaign can have a mediocre click-through rate and still be the most profitable one running, because the people it reaches are the ones statistically most likely to buy. This is the objective most Facebook ad campaigns should graduate toward once purchase data exists.
How to Lead With Each Objective
Choosing the right objective is only half the job. Each one also needs a different first move once it is live, matched to what the objective is actually optimising for.
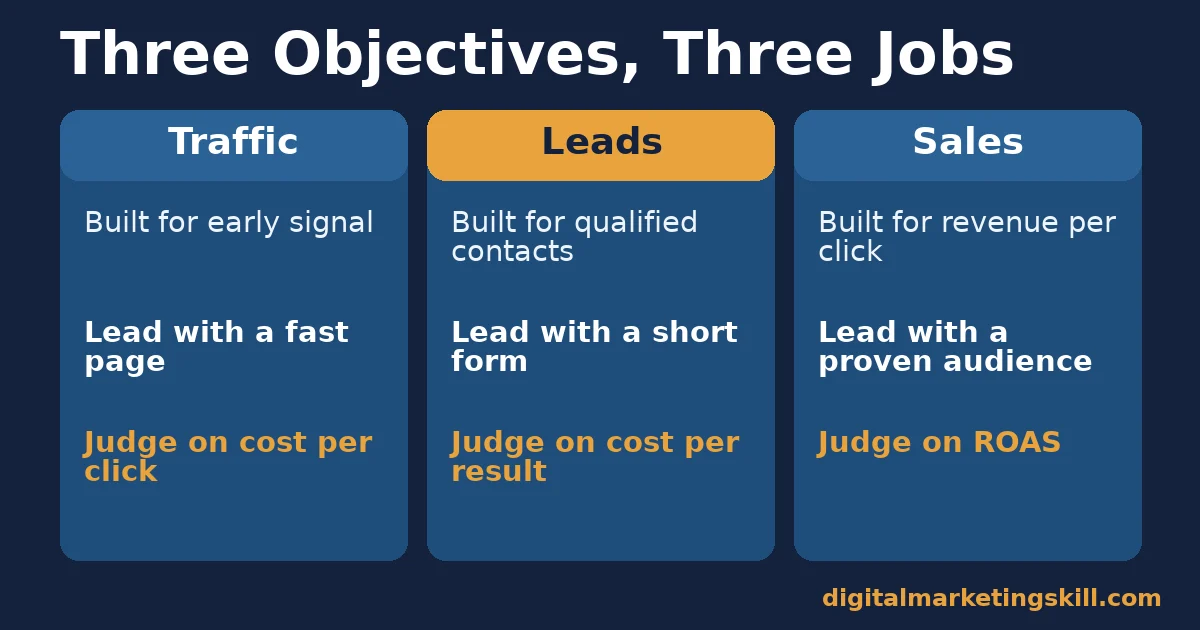
Lined up side by side, the three objectives show a clear pattern. Traffic campaigns are built for early signal and led with speed. Lead campaigns are built for qualified contacts and led with a short, focused form. Sales campaigns are built for revenue per click and led with an audience you have already proven.
Matching the “lead with” move to the “built for” purpose is what separates Facebook ad campaigns that scale from ones that stall after the first week.
Traffic Campaigns: Lead With a Fast Landing Page
Send traffic clicks to a page that loads in a couple of seconds and makes one offer, not a menu of options. A traffic campaign that drives clicks to a slow or cluttered page wastes most of what it buys. The ad already did the hard part of earning attention.
Track click-to-view-content rate on the landing page itself, separate from the ad’s own click-through rate. A gap between the two numbers usually means the page, not the ad, is the problem.
Lead Campaigns: Lead With a Short Form
Cut the lead form down to the fields the very next step requires. That is typically a name, an email address or phone number, and one qualifying question about budget or timeline. Every additional field is a chance for someone to abandon the form before finishing it.
Follow up fast. A lead that waits two days for a reply has usually moved on. Route new leads straight into your customer relationship system or inbox the moment they arrive, so the speed of your reply works alongside the targeting.
Sales Campaigns: Lead With Your Proven Audience
Start sales campaigns on the audience most likely to already trust you. That means people who have visited your site, engaged with your page, or match your existing customers through a lookalike audience built on Facebook’s targeting tools. Keep that audience wide enough. A pool stacked with too many filters can collapse below a workable size for the auction to learn from.
Give the pixel time to collect enough purchase events before judging results. Resist pausing the campaign after one slow day. A sales campaign still inside its learning phase has not yet shown its real cost per result.
How to Measure Facebook Ad Campaigns
A Facebook ad campaign produces more numbers than any one person needs to watch daily, but a handful, read in the right order, tell you almost everything that matters.
Six Numbers Worth Watching Every Week
- Click-through rate (CTR). The share of people who saw the ad and clicked it. A low CTR against a healthy audience size usually points to weak creative or a mismatched audience.
- Cost per click (CPC). What each click costs on average. Compare it against your own account history first, since published benchmarks blend many industries and objectives.
- Cost per mille (CPM). What it costs to reach 1,000 impressions. One blended industry estimate puts CPM around $14.19, ranging from about $6.80 to $28.40 by industry. Rising CPM with flat CTR often signals more competition in the auction, not a problem with your ad.
- Cost per result. What a lead, sale or chosen action actually costs, once the learning phase has settled. This is the number that should drive budget decisions, not CTR or CPM alone.
- Return on ad spend (ROAS). Revenue generated for every unit of currency spent on the campaign. It is used mainly for sales objectives with pixel tracking in place.
- Frequency. The average number of times one person has seen the ad. Rising frequency with falling CTR is the clearest sign that an audience needs fresh creative.
How to Read Them Together
Read cost per result first, because it sits closest to your actual goal. If cost per result is climbing, check frequency next. A tired audience is a common and cheap problem to fix with new creative. If frequency is low but cost per result is still high, the issue is more likely the offer, the landing page or the audience itself.
Give every reading at least a full week before acting on it, and more where the daily volume of actions is small. A campaign that produces ten results a day tells you more in one week than a campaign producing one result a day tells you in three.
The One Decision Rule: Test With Separate Budgets, Scale With One Shared Budget
Remember one rule from this guide and make it this one. Test new audiences and creative with a separate, fixed budget on each ad set. That way every concept gets a fair chance to prove itself before money moves. Once a concept is proven, move it under one shared campaign budget. Let the delivery system shift spend toward whichever ad set is performing best in real time.
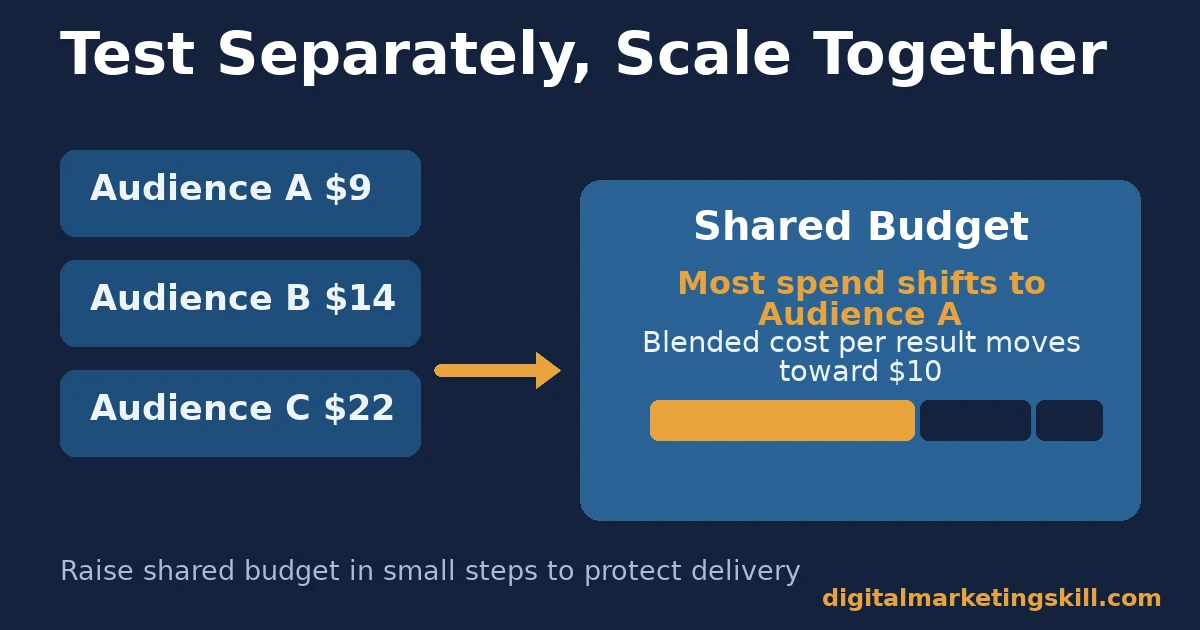
Here is an illustrative example, with invented numbers. A campaign tests three audiences at $20 a day each, under separate budgets, for one week. Audience A returns a $9 cost per result, audience B returns $14, and audience C returns $22.
The advertiser then moves all three into one shared $60 daily budget. Within a few days, the system shifts most of the spend toward audience A. The blended cost per result across the whole campaign drops toward $10, without any manual reallocation.
When you do scale a shared budget, raise it gradually. A sudden jump can reset the learning phase and cause a short-term spike in cost per result. Stepped increases protect the stability the testing phase already bought for your Facebook ad campaigns.
A Real Case: Small Budget, Real Return
According to a story published on the Digital Marketing Skill Institute’s own reviews page, one graduate, Ayooluwa Osemi, spent $14 on a small Facebook and Instagram ad test. That test generated $878 in sales. The figure is the student’s own published account of their result.
Treat this as one real case, not a formula. A single campaign’s return depends on the product, the audience, the offer and timing, in ways a $14 test cannot fully prove out. Results like this are not typical or guaranteed. DMSI’s own earnings disclaimer makes the same point: individual results vary, and no income or outcome is promised.
The useful lesson is the shape of the test, not the multiple. A small, fixed budget aimed at one clear offer is a reasonable way to find out whether an audience responds at all, before committing a larger budget to Facebook ad campaigns built around it.
That shape matters more than the size of the win because it is repeatable. Anyone can run the same low-risk test on a new product, a new audience, or a new piece of creative, and read the result the same way: as one signal to confirm before spending more, not as proof that the next test will behave the same way.
Frequently Asked Questions About Facebook Ad Campaigns
How much does a Facebook ad campaign cost?
There is no fixed price. Published benchmark reviews put average cost per click near $0.70 for traffic campaigns and around $1.92 for lead campaigns. Your own cost depends on your industry, audience size, bid and ad quality, and these published figures skew toward US advertising accounts.
How do I structure a Facebook ad campaign?
Facebook ad campaigns have three levels. The campaign level sets the objective and overall budget strategy, while the ad set level sets the audience, placement and budget for that specific concept. Below that, the ad level holds the actual creative, copy and call to action shown to people.
How long should I wait before judging a Facebook ad campaign?
Give a new campaign at least a full week, and longer if it produces fewer than a handful of results a day. Judging a campaign after a single day or two almost always reacts to noise, not to a real pattern in performance.
Should I test several audiences at once or one at a time?
Test several audiences at once, each with its own separate budget, so every concept gets the same fair chance. Testing one at a time takes longer, and it makes results harder to compare fairly, since conditions in the auction change week to week.
Why did my Facebook ad campaign stop getting results?
The most common cause is rising frequency. The same audience has seen the ad enough times that it has stopped responding. Refresh the creative first, and check whether the audience has become too narrow to keep finding new people.
Do I need the Meta Pixel to run a Facebook ad campaign?
Not for a simple traffic or lead campaign. You do need it, or the Conversions API, to run a sales campaign well. Without purchase data flowing back to Facebook, the delivery system has nothing to optimise toward, so it cannot learn who is likely to buy, no matter how well the audience or creative is built.
What is a realistic first budget for new Facebook ad campaigns?
There is no universal number, but a small, fixed daily budget held for a full week per test audience is a reasonable starting point. It is enough to generate signal without risking money on an idea that has not yet proven it can convert.
Putting Facebook Ad Campaigns to Work
A Facebook ad campaign performs best when the objective, the audience and the first week of patience all line up. Pick the objective that matches what you actually want someone to do. Keep the audience wide enough for the system to learn. Track cost per result rather than CTR alone, and resist judging anything before a full week of data comes in.
If you want to build this skill properly, alongside the wider discipline of paid and organic growth, Digital Marketing Skill Institute teaches it hands-on inside the Master Diploma in Digital & AI Marketing. The programme includes nine practical courses, among them AI-powered Google advertising, AI-powered social media marketing and analytics, and AI-powered content creation.
It comes with unlimited 1-on-1 coaching and mentoring, and real project work inside a U.S. partner company. It is dual US and UK accredited, and recognised in more than 100 countries.
The programme is fully online, so you can study from anywhere in your country. Browse more guides on the Digital Marketing Skill Institute blog, read more student outcomes on the reviews page, and when you are ready, apply for the Master Diploma or start from the Digital Marketing Skill Institute homepage.
Every figure in this guide was checked against its original source before publication. Figures marked as illustrative are invented examples, not real results.
![9 Amazing Digital Marketing Skills to Make Money Online [With Proof]](https://digitalmarketingskill.com/wp-content/uploads/2019/07/9-Amazing-Digital-Marketing-Skills-to-Make-Money-Online-With-Proof-17.png)






