
Blog readership grows when the first screen proves a post is worth the reader’s time. Most visitors decide in seconds: Chartbeat found that 55% spent fewer than 15 seconds actively on a page. So fix the headline promise, the opening answer and the scan path before you publish more posts.
Key Takeaways
- The decision happens fast. Chartbeat analysed about 2 billion visits and found 55% of visitors spent fewer than 15 seconds actively on a page; on article pages it was about one in three.
- Shares are not reading. The same Chartbeat analysis found no relationship between how often content was shared and how much attention readers gave it.
- People scan before they read. In Nielsen Norman Group’s eye-tracking study of 232 users, readers moved across the top of the page, then down the left side, in an F-shaped pattern.
- Most posts are never found. Ahrefs studied about 14 billion pages and found that 96.55% get no traffic from Google, so discovery is part of blog readership too.
- Effort is common; results are not. In Orbit Media’s survey of 1,042 content marketers, the average post took over three hours to write, yet only 13.9% reported strong results.
In this guide
- What Most Blog Readership Advice Gets Wrong
- How Readers Decide Whether to Read Your Blog
- Blog Readership Comes From Three Kinds of Reader
- How to Win Each Kind of Reader
- Five Reasons People Stop Reading Your Blog Posts
- How to Measure Blog Readership
- The Most Useful Rule: Fix the First Screen Before You Publish More
- A Four-Week Plan to Lift Blog Readership
- A Real Case: Why Upworthy Started Counting Attention
- Frequently Asked Questions About Blog Readership
- Start With Your Top Post, Then Expand
What Most Blog Readership Advice Gets Wrong
Most advice on blog readership says the same thing: write better content, post more often and share it everywhere. None of that is wrong. But it skips the moment that decides everything, which is the few seconds after someone lands on your page.
This guide focuses on that moment. It explains how readers decide whether to stay, how that decision differs for searchers, social visitors and subscribers, and what to change for each. It also shows how to measure real reading rather than clicks.
Here are the ground rules. The Chartbeat figures come from a large analysis of real visits, reported by the company’s own chief executive, so read them as one company’s data. Orbit Media’s figures are self-reported by marketers. The three-reader model is our own framework, an informed inference from that evidence, not a settled fact. Treat every number as a snapshot, not a permanent ranking.
How Readers Decide Whether to Read Your Blog
A reader’s decision happens in four quick steps. First, they arrive with an expectation set by the headline or the link that brought them. Next, they judge the first screen against that expectation. Then they scan for proof that the post delivers. Finally, they either commit to reading or leave.
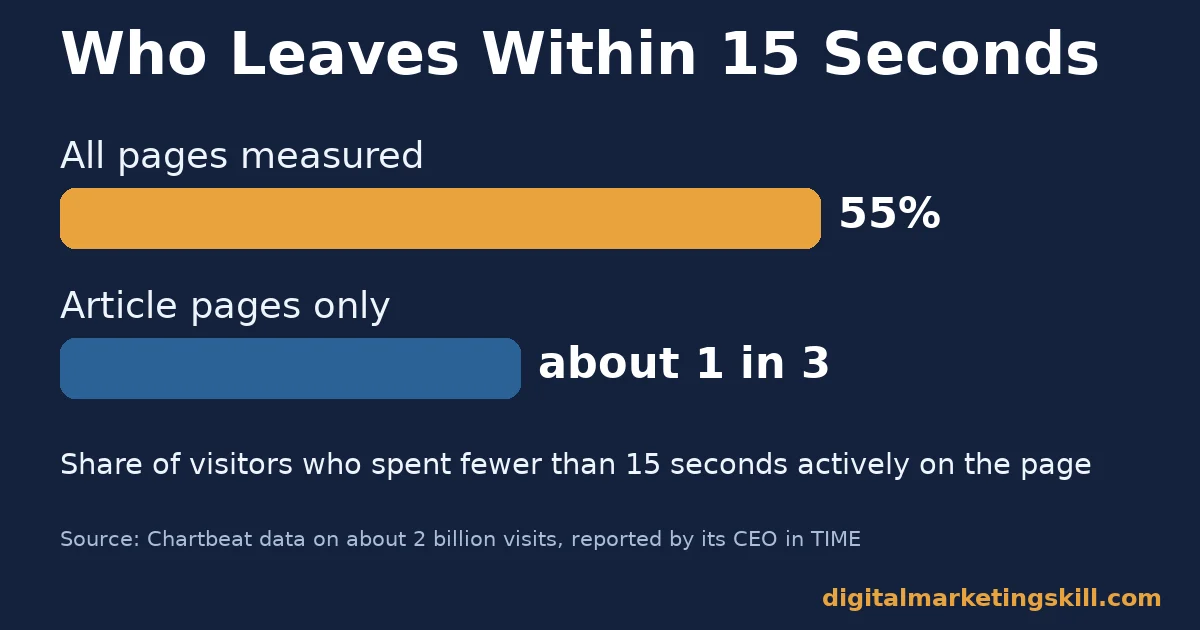
The first screen carries most of the weight. Chartbeat’s chief executive, Tony Haile, wrote in TIME that the company looked at about 2 billion visits over a month. It found that 55% of visitors spent fewer than 15 seconds actively on a page. Even on article pages, about one in three visitors left within 15 seconds.
Scanning shapes what readers see in those seconds. Nielsen Norman Group recorded how 232 users looked at thousands of web pages. Readers moved across the top of the content, then across a second line lower down, then down the left side. Its advice was blunt: the first two paragraphs must state the most important information.
What the First Screen Must Show
On a phone, the first screen is roughly the headline, an image and two short paragraphs. That small space has to do three jobs. It must confirm the reader is in the right place, show the answer or payoff, and signal that the rest of the post is easy to scan.
Most weak openings fail the first job. They start with background, a story about the writer or a definition the reader already knows. Strong blog readership starts with the reader’s question, answered plainly, followed by a reason to keep going.
Why Shares and Clicks Do Not Mean Readers
It is tempting to judge blog readership by clicks and shares. However, Chartbeat found no relationship between how much a piece was shared and how much attention an average reader gave it. People often share a headline they never read.
Clicks have the same weakness. A click proves the headline worked, not the post. So if you only track page views, a misleading headline can look like a success while readers leave in seconds. That is why this guide measures attention, not traffic.
Blog Readership Comes From Three Kinds of Reader
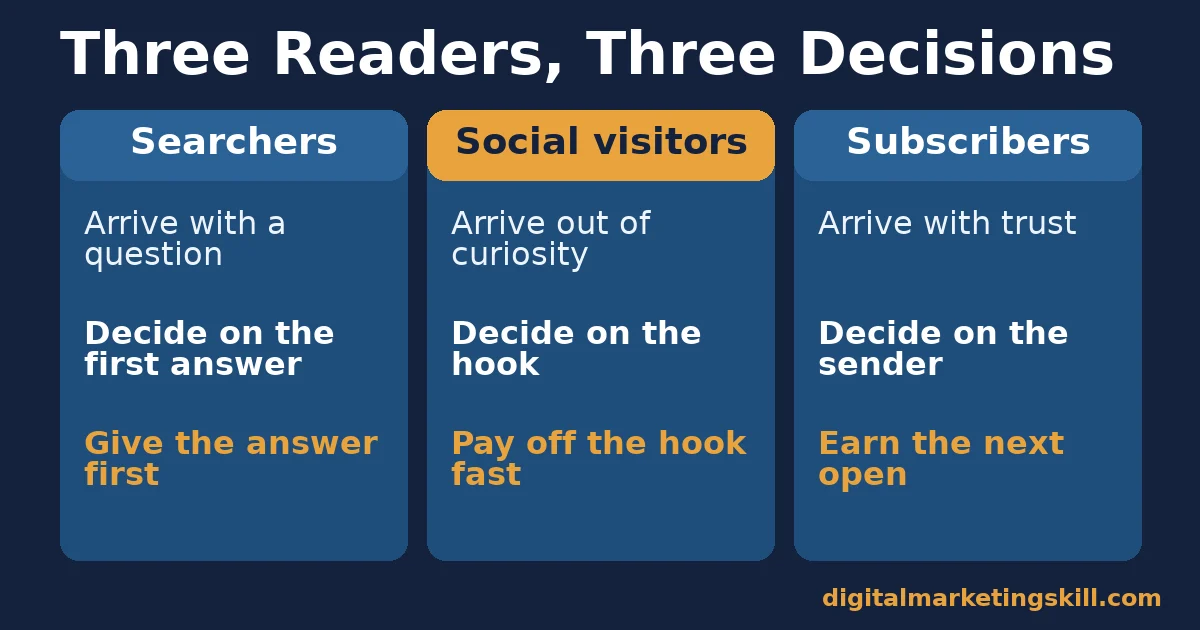
Not every visitor reads the same way. A person who searched for an answer behaves differently from someone who tapped a social post, and both differ from a loyal subscriber. Each arrives with a different expectation, so each makes a different first-screen decision.
Searchers: Built to Find an Answer Fast
Searchers arrive with a question. They compare your page with the other results they could have clicked, so they leave quickly if the answer is buried. Google’s guidance on helpful, people-first content asks whether a reader will “leave feeling they’ve learned enough” to reach their goal.
Searchers also need to find you first. Ahrefs looked at about 14 billion pages in its search traffic study and found that 96.55% get no Google traffic. So for search readers, blog readership starts with choosing topics people actually search for.
Social Visitors: Built on Curiosity
Social visitors arrive because a post made them curious. They were not looking for you, so their patience is low. If the article does not deliver what the post promised within the first screen, they return to their feed.
This is where clickbait backfires. A dramatic social post can win the click, but the gap between promise and page sends readers away fast. That gap also teaches your audience to ignore your next post.
Timing matters too. A social post sends a short burst of visitors, so the page must load quickly and show its point at once. If the burst lands on a slow or cluttered page, most of it is wasted.
Subscribers: Built on Trust
Subscribers arrive because they trust you. They chose to hear from you, usually by email, and they decide whether to open based on the sender as much as the subject line. That trust is valuable, because subscribers return without you paying for each visit.
Subscribers are also your most forgiving readers. They will read a longer post if the last few have been worth it. Trust is also fragile. If several emails in a row lead to thin posts, subscribers stop opening. Our guide to email deliverability explains how poor engagement can also push your messages towards spam folders.
How to Win Each Kind of Reader
Each reader type needs a different first move. The sections below mirror the three readers above. Start with the type that brings most of your visits today, because a fix there improves blog readership fastest.
Searchers: Lead With the Answer
Put a direct answer to the search question in the first two or three sentences. Then use subheadings that begin with the words searchers scan for, as Nielsen Norman Group recommends. A searcher who sees the answer and a clear structure is far more likely to keep reading.
Also match the format to the search. Someone searching “how to” wants steps, while someone searching “best” wants a comparison. For the technical side, our guide on how to optimise a blog post for search engines covers titles, headings and structure.
Social Visitors: Lead With a Hook the Post Keeps
Write the social post last, after the article is finished. Pull the hook from the strongest point in the piece, so the page delivers exactly what the post promised. Then repeat that point near the top of the article, where the visitor will look first.
Keep the first screen light. A short opening, one clear image and a visible first subheading tell a curious visitor that the payoff is close. Long introductions lose social readers before the useful part begins.
Subscribers: Lead With a Reliable Promise
Tell subscribers what they will get and when, then keep that promise every time. A fixed day and a consistent type of post build a habit. In each email, summarise the single most useful idea, so readers can see the value before they click.
Judge email by clicks rather than opens. Mailchimp’s email benchmarks put the all-industry average click rate at 2.62%, while open rates are distorted by Apple’s Mail Privacy Protection. Mailchimp itself warns that this feature can affect the accuracy of open data.
Five Reasons People Stop Reading Your Blog Posts
When blog readership stalls, the cause is usually one of five problems. Check each one against your three most recent posts, because patterns show up quickly.
- The post adds nothing new. If a reader can get the same points from the top search result, they have no reason to stay. Add your own data, a real example or a clear opinion with reasons.
- It is written for nobody in particular. Generic posts try to serve everyone and satisfy no one. Name the reader and the problem before you write the first line.
- It is hard to find. A great post nobody can find has no readers. Choose topics with real search demand and share each post where your readers already spend time.
- It is a wall of text. Long, unbroken paragraphs fail the scan test. Use short paragraphs, clear subheadings and visuals that explain rather than decorate.
- There is no follow-up. Readers who enjoyed one post forget you unless you invite them back. Offer an email sign-up and send new posts to subscribers.
Which Problem to Fix First
Orbit Media’s survey suggests visuals matter: it reports that the more visual the content, the more likely it is to drive results. That is a correlation in self-reported data, not proof, but it fits the scanning behaviour described above.
Start with the reason your numbers point to. If few people find your posts, work on topics and promotion. If many arrive but leave fast, fix the opening and the layout. And if readers finish but never return, build the follow-up. Fixing the right problem first saves weeks of effort on blog readership.
For the same idea applied to a whole content programme, see our guide to content marketing challenges and how to fix each one. It uses the same diagnose-first approach, step by step, from audience to measurement.
How to Measure Blog Readership
Readership is about attention, so measure attention rather than visits. Each metric below is defined in one sentence, with a note on how to read it. They sit alongside the traffic numbers you already track in Google Analytics and Search Console.
Six Metrics That Show Real Reading
- Engagement rate. Google Analytics counts a session as engaged when it lasts longer than 10 seconds, has a key event, or includes two or more page views. Engagement rate is the share of sessions that are engaged, so it is a direct test of the first screen.
- Average engagement time. This is how long the page was in focus on a reader’s screen. Compare it with the time a typical reader needs to finish the post.
- Scroll depth. With enhanced measurement, Google Analytics records a scroll event the first time a reader reaches 90% of the page’s height. The share of readers who trigger it shows how many reach the end.
- Search impressions. Search Console counts how many times your pages appeared in Google results. Rising impressions on a post show that search is starting to send it readers.
- Returning readers. This is the share of visitors who come back within a month. Rising returns show that readers trust you enough to come back unprompted.
- Email click rate. This is the share of subscribers who click through to a post. Compare it with your own past sends, and use Mailchimp’s 2.62% average only as a rough guide.
How to Read These Numbers Together
Read the metrics in order. A low engagement rate means the first screen is failing, so fix the headline and opening. If engagement is fine but few readers reach 90%, the middle of the post is too long or too slow. And if readers finish but never return, the follow-up is missing.
Track one post at a time. When you change a headline or an opening, note the date in a simple spreadsheet and compare the next four weeks with the four weeks before. That turns guesses about blog readership into evidence.
The Most Useful Rule: Fix the First Screen Before You Publish More
If you remember one decision rule from this guide, make it this one. Before you write a new post, check that your most visited posts pass the first-screen test. More posts with weak openings only multiply the problem.
Here is an illustrative example, with invented numbers. A small travel blog gets 3,000 visits a month to its top ten posts, but its engagement rate is only 35%. The owner rewrites the first screen of those ten posts so each answers its question within two sentences. Over the next month, engagement rises to 52% and email sign-ups double, without a single new post.
The lesson is about leverage. Those ten posts already had visitors, so improving them changed what thousands of real readers saw. A new post would have started from zero.
A Four-Week Plan to Lift Blog Readership
You do not need a redesign to see results. This plan takes about an hour a week and uses only free tools.
- Week one: find your top ten posts. In Google Analytics, list the ten posts with the most visits, with the engagement rate for each.
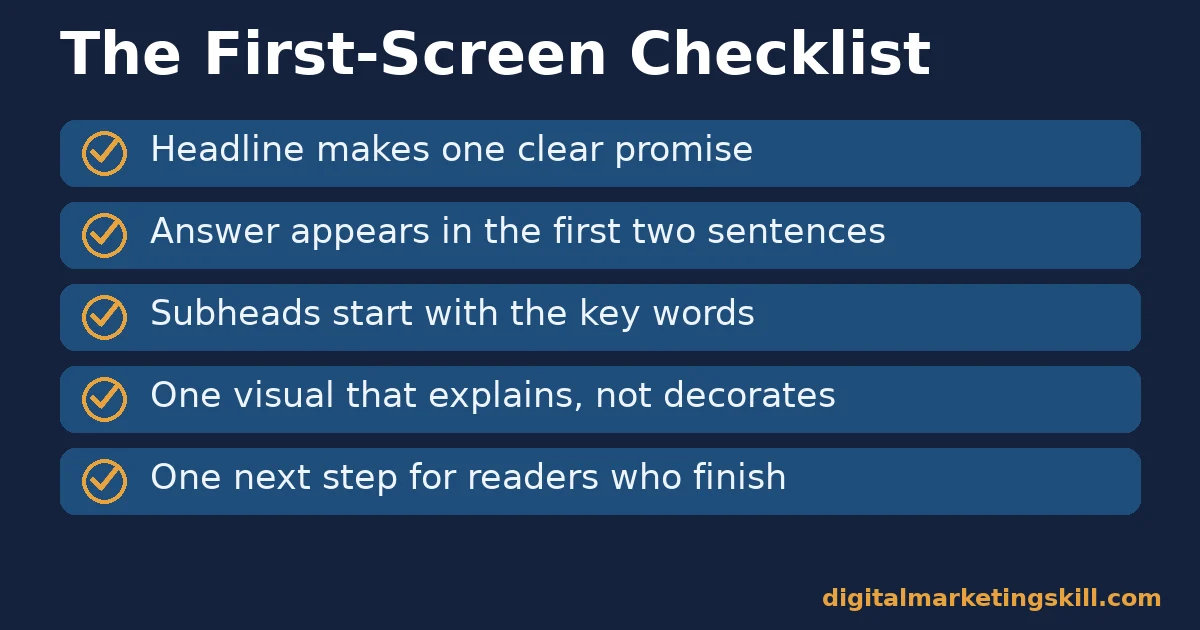
- Week two: rewrite the first screens. For each post, put the answer in the first two sentences and make the first subheading visible without scrolling.
- Week three: fix the scan path. Break long paragraphs, add subheadings that start with key words, and add one visual that explains a point.
- Week four: add the follow-up. Place an email sign-up after the most useful section, and link each post to one related guide.
At the end of the month, compare engagement rate and scroll depth with the month before. Keep the changes that moved the numbers, and repeat the plan with the next ten posts. This steady cycle builds blog readership without adding to your writing load.
A Real Case: Why Upworthy Started Counting Attention
Upworthy, the media site, built its own attention metric because clicks and visits did not show whether people actually read or watched. Its engineering team wrote that “Attention Minutes” give a more accurate picture of user experience than page views and unique visitors.
The method was simple. According to Upworthy’s engineering blog, a page counted as having attention when it had focus and the user had interacted within a 5-second window, or when a video was playing. Interactions included clicks, scrolls, mouse movement and touch.
The case shows the principle behind this guide: measure what readers do, not just whether they arrived. Keep the limits in mind, though. Upworthy was a large media site, and its write-up describes the method rather than publishing results, so treat it as a model for measurement rather than proof of a specific gain.
Frequently Asked Questions About Blog Readership
Why do people not read my blog posts?
Most visitors decide within seconds whether a post is worth their time. Chartbeat found 55% of visitors spent fewer than 15 seconds actively on a page, so a slow opening or a missing answer loses them fast.
How do I increase blog readership quickly?
Rewrite the first screen of your most visited posts so each answers its question within two sentences. Then add clear subheadings and one useful visual. Improving pages that already get visits is usually faster than publishing new ones.
How long should a blog post be?
Long enough to answer the question fully, and no longer. Orbit Media’s survey puts the average post at 1,312 words, but readers judge usefulness, not length.
Do social media shares mean people read my blog?
No. Chartbeat found no relationship between how often content was shared and how much attention readers gave it. Track engagement rate and scroll depth instead.
Which metrics show real blog readership?
Engagement rate, average engagement time, scroll depth, returning readers and email click rate. Together they show whether people start, finish and come back.
What is a good engagement rate for blog readership?
There is no single good figure, because engagement varies by topic and traffic source. The most useful benchmark is your own posts, so compare each post with your site average and improve the weakest first.
Should I still email new posts to subscribers?
Yes, because subscribers return without paid promotion. Judge those emails by click rate rather than open rate, since Apple’s privacy features distort opens.
Start With Your Top Post, Then Expand
Blog readership improves fastest when you fix what readers already see. Pick your most visited post, check its first screen against the checklist above, and rewrite the opening so it answers the reader’s question at once. Then measure its engagement rate for a month before you move to the next post. If your blog is still new, our guide on how to start and grow a blog covers the foundations.
If you want guided practice, Digital Marketing Skill Institute teaches these skills hands-on. The Master Diploma in Digital & AI Marketing includes nine practical courses, among them AI-powered SEO and content marketing, AI-powered content creation and AI-powered Google Analytics. It comes with unlimited 1-on-1 coaching and mentoring and real project work inside a U.S. company. The diploma is dual US and UK accredited and recognised in more than 100 countries.
The programme is fully online, so you can study from anywhere in your country. You can find more guides on the Digital Marketing Skill Institute blog, and when you are ready, apply for the Master Diploma or start from the Digital Marketing Skill Institute homepage.
Every figure in this guide was checked against its original source before publication. Figures marked as illustrative are invented examples, not real results.
![9 Amazing Digital Marketing Skills to Make Money Online [With Proof]](https://digitalmarketingskill.com/wp-content/uploads/2019/07/9-Amazing-Digital-Marketing-Skills-to-Make-Money-Online-With-Proof-17.png)






