
Bounce rate measures how many visits leave without engaging. In fact, in Google Analytics 4 it is the direct opposite of engagement rate. This guide explains how GA4 actually defines a bounce, the two different causes behind a high bounce rate, and the fix for each, backed by real case data.
Key Takeaways
- Bounce rate changed definition. In GA4, bounce rate is the share of sessions that were not engaged. It is the opposite of engagement rate (Google Analytics Help).
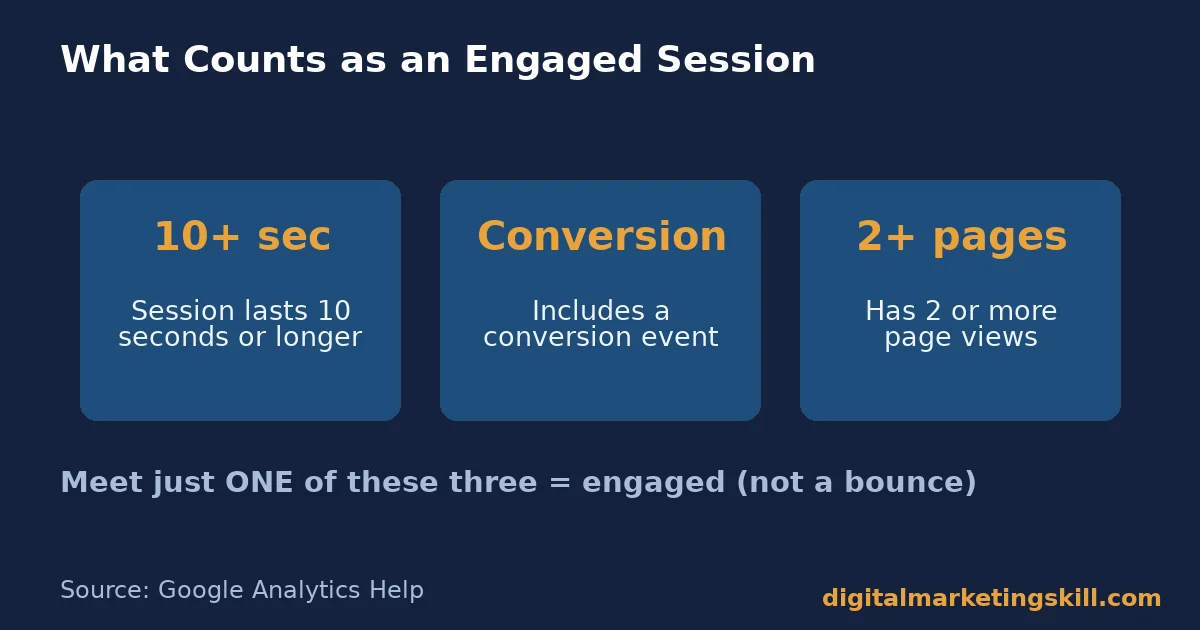
- An engaged session, in practice, needs one of three things. It must last 10 seconds or more, include a conversion event, or have 2 or more page views (Google Analytics Help).
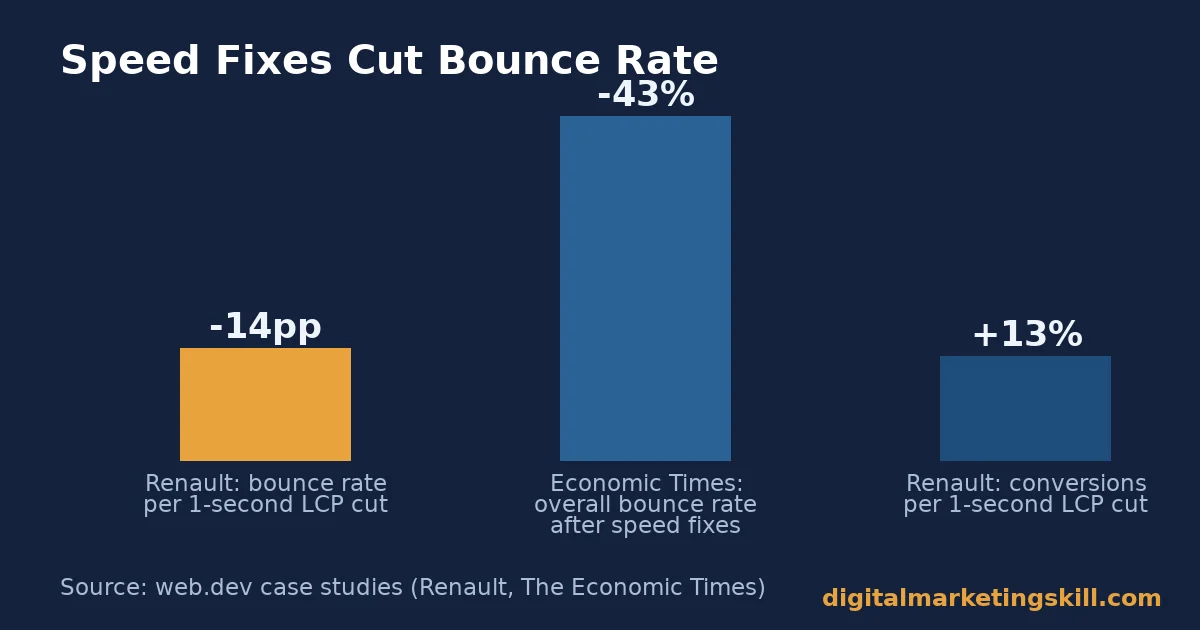
- Speed moves the number a lot. Renault found that cutting load time (LCP) by one second was linked to a 14 percentage point drop in bounce rate. Conversions rose 13%, from over 10 million visits across 33 countries (web.dev, Renault case study).
- Real publishers prove it. The Economic Times cut its Largest Contentful Paint from 4.5 seconds to 2.5 seconds. Bounce rate fell 43% overall (web.dev, Economic Times case study).
- Page experience is a ranking factor. Google confirms Core Web Vitals and HTTPS are used by its ranking systems, as part of page experience (Google Search Central).
In this guide
- What Most Bounce Rate Advice Gets Wrong
- How GA4 Actually Defines Bounce Rate
- Bounce Rate Has Two Different Causes
- How to Fix Each Type of Bounce Rate Problem
- How to Measure Bounce Rate Properly
- The One Decision Rule: Fix Speed Before You Touch the Words
- A Real Case: How The Economic Times Cut Bounce Rate by Fixing Three Metrics
- Frequently Asked Questions About Bounce Rate
- Next Step: Check Your Slowest Page Before You Rewrite Anything
What Most Bounce Rate Advice Gets Wrong
In practice, most bounce rate guides give one long checklist. Add internal links. Speed up the page. Improve the content. Trim the ads. None of that advice is wrong, but it skips a basic question. A slow page and a page that answers the wrong question both produce a high bounce rate. They need different fixes.
Instead, this guide splits bounce rate into its two real causes: speed and content mismatch. Each gets a separate fix. It also covers how bounce rate is actually measured today, since the metric’s meaning has changed and many guides still describe the old version.
A few ground rules first. The case studies below come from Google’s own web.dev platform. Each one, in other words, names the company, the change made and the result. However, correlation in a regression study is not a guarantee for your site, so treat these as a strong signal, not a formula. Always check your own numbers before and after a change.
How GA4 Actually Defines Bounce Rate
In short, bounce rate in GA4 is simply the inverse of engagement rate. If a session counts as engaged, it is not a bounce. If it does not meet the bar for engagement, GA4 counts it as a bounce (Google Analytics Help).
This is, in fact, a real change from the old Universal Analytics definition. That older version counted a bounce as any session with only one page view, no matter how long the visitor stayed. A visitor who spent five minutes reading one long article used to count as a bounce. In GA4, that same visit is engaged. It no longer counts against you.
What Counts as an Engaged Session
GA4 counts a session as engaged if it meets any one of three conditions. It lasts 10 seconds or longer. It includes a conversion event. Or it has 2 or more page views. Meeting just one of these is enough.
This matters for how you read your reports. So a single-page visit that holds attention for 11 seconds is now engaged, not bounced. So a rising bounce rate in GA4 means visitors are leaving fast and doing nothing else. It no longer just means they viewed one page.
Why the Change Matters for Blogs and Guides
The old metric punished single-page content unfairly. However, a reader who finished a long guide in one sitting, then left satisfied, used to count the same as someone who left in two seconds. GA4’s engaged-session model fixes that gap. Long-form content now gets fairer credit for holding attention.
Because of this change, do not compare a GA4 bounce rate with an old Universal Analytics figure. They measure different things. A “good” bounce rate under the old system is not the same target under the new one.
Bounce Rate Has Two Different Causes
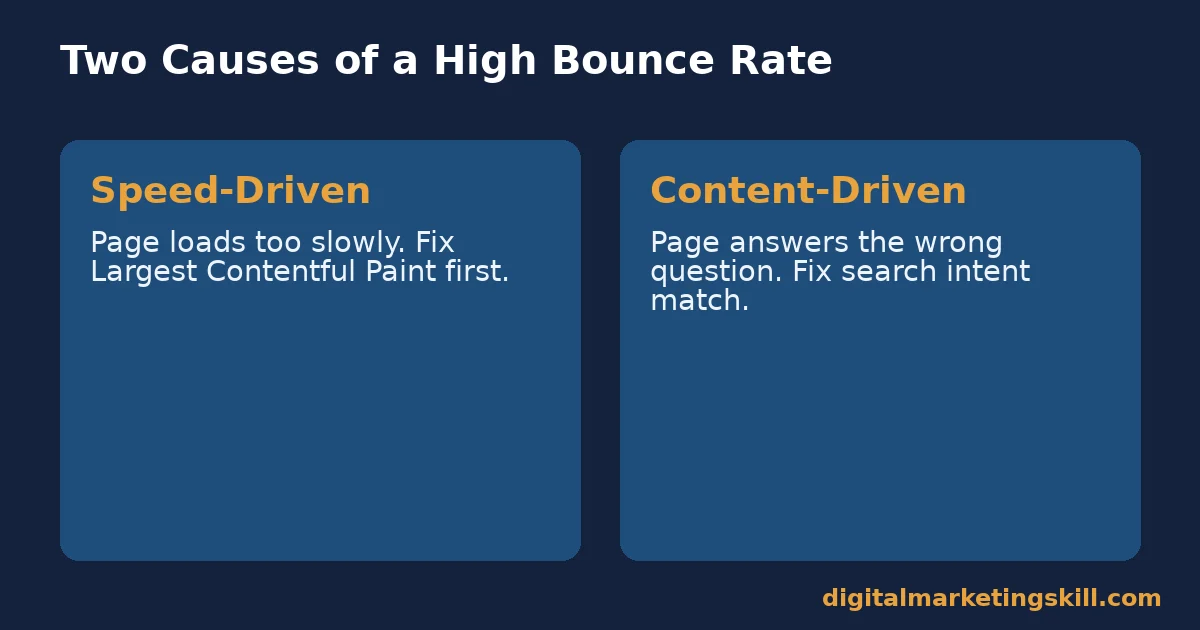
A high bounce rate almost always comes from one of two problems. Either the page was too slow to prove its value, or it did not match what the visitor wanted. So diagnose which one you have before changing anything.
Speed-Driven Bounces: Built From Page Experience
Some visitors leave before the page even finishes loading. Google’s page experience signals, which include Core Web Vitals and HTTPS, are built around this exact risk. Google confirms it uses them in ranking, alongside content relevance. Getting this right is part of the wider work covered in our guide to search engine optimization.
The clearest evidence is Renault’s own data. The brand analysed over 10 million visits across 33 countries. Each one-second cut in Largest Contentful Paint was linked to a 14 percentage point drop in bounce rate, and a 13% rise in conversions. That is a huge swing for one technical metric (web.dev, Renault case study).
Content-Driven Bounces: Built From a Search Intent Mismatch
Other visitors leave because the page loaded fine but answered the wrong question. This happens when a page targets a keyword without matching what someone searching that term actually wants. They bounce back to the results and pick a different page.
So this type of bounce shows up clearly when you compare Google Search Console clicks against GA4 engagement, for the same page. High clicks paired with a high bounce rate is a strong signal. The page is being found, but it is not satisfying the visitor’s intent.
How to Fix Each Type of Bounce Rate Problem
The sections below mirror the two causes above. First, diagnose using the comparison method described. Then apply the matching fix, rather than guessing.
Speed-Driven: Lead With Largest Contentful Paint
Start by measuring your Largest Contentful Paint on real user data, not just a lab test. The Economic Times improved LCP from 4.5 seconds to 2.5 seconds, an 80% gain. Bounce rate fell 43% overall. The same page speed and navigation fixes are covered in more depth in our guide to website optimization.
So prioritise LCP over smaller speed tweaks. A one-second LCP gain did more for Renault’s bounce rate than most content changes could. Treat page speed as a content decision, not just a developer task.
Content-Driven: Lead With Matching Search Intent
So rewrite the opening of the page so it answers the exact question behind the keyword, within the first few sentences. If someone searches a how-to term and lands on a product page, no amount of polish fixes that mismatch. The page needs to become a how-to page, or link clearly to one.
Also check format as well as topic. A searcher wanting a comparison does not want a single-product review. A searcher wanting steps does not want a long opinion piece. Matching the expected format is often the fastest way to cut a content-driven bounce rate. It also tends to lift your website conversion rate at the same time.
How to Measure Bounce Rate Properly
Bounce rate alone does not say why visitors left. So pair it with the metrics below to diagnose the real cause before you act.
Four Metrics That Explain a Bounce Rate Number
- Bounce rate. The share of sessions that were not engaged, as defined above. Use it as the headline number, not the full diagnosis.
- Largest Contentful Paint. The time it takes the biggest visible element to render. Treat anything over 2.5 seconds as a likely driver of speed-driven bounces.
- Search Console clicks versus GA4 bounce rate, by page. High clicks with a high bounce rate on one page points to a content or intent mismatch, not a speed problem.
- Engaged sessions per user. A low figure across many pages suggests a site-wide issue, such as slow global assets, rather than one weak page.
Reading These Numbers Together
Start with Largest Contentful Paint. If it is slow, fix that first. Speed problems can mask whether your content is actually a good match for the visitor. Once LCP is under control, compare Search Console clicks with bounce rate page by page, to spot content mismatches. Fixing speed before content avoids wasting effort rewriting a page that was simply too slow to read.
The One Decision Rule: Fix Speed Before You Touch the Words
If you take one rule from this guide, make it this one. So measure Largest Contentful Paint before you rewrite a single sentence. A slow page can produce a high bounce rate no matter how good the content is underneath it.
Here is an illustrative example, with invented numbers. A small services site has a guide with a 68% bounce rate and a 4.8-second LCP. The owner assumes the content is weak and rewrites it twice. Bounce rate does not move.
After that, the owner compresses the hero image and removes a render-blocking script. LCP drops to 2.3 seconds. Bounce rate falls to 51% within two weeks, with no further content changes.
The lesson is about sequencing. Content fixes and speed fixes can look identical in a bounce rate chart. Testing speed first removes the biggest confounding variable before you spend time rewriting.
A Real Case: How The Economic Times Cut Bounce Rate by Fixing Three Metrics
The Economic Times, a major news publisher, targeted all three Core Web Vitals at once, rather than picking one. Over roughly nine months, it improved LCP by 80%, from 4.5 seconds to 2.5 seconds. Cumulative Layout Shift improved 250%, from a score of 0.25 to 0.09, according to its case study published on web.dev.
The combined effect was a 43% drop in overall bounce rate. The publisher did not change its editorial approach or its headlines. Every bit of that gain came from technical performance work, on pages that were already being found by search and social traffic.
The case is a useful limit check. A large publisher with a dedicated engineering team can run performance work at this scale quickly. A small site may see a smaller or slower version of the same effect. Treat the 43% figure as a ceiling this type of fix can reach, not a guaranteed outcome.
Frequently Asked Questions About Bounce Rate
What is a good bounce rate?
There is no single good figure. GA4’s engaged-session definition makes bounce rate vary a lot by content type and traffic source. Compare each page against your own site average, not a fixed industry number.
Why did my bounce rate change after switching to GA4?
GA4 counts a session as a bounce only if it is not engaged: it did not last 10 seconds, include a conversion, or reach 2 page views. This is stricter in some cases and looser in others than the old single-page-visit definition. Direct comparisons are not meaningful.
Does page speed really affect bounce rate that much?
Yes. Renault’s analysis of over 10 million visits linked each one-second cut in Largest Contentful Paint to a 14 percentage point drop in bounce rate. The Economic Times saw a 43% overall drop after improving all three Core Web Vitals.
How do I know if my bounce rate problem is speed or content?
Check Largest Contentful Paint first. If it is under 2.5 seconds and bounce rate is still high, compare Search Console clicks against bounce rate for that page. That points to a search intent mismatch.
Is a high bounce rate always bad?
No. A single-page visit that still counts as engaged, through dwell time, a conversion, or a second page view, is not counted as a bounce in GA4. So a short, single-answer page can have a low bounce rate and still do its job well.
Does bounce rate directly affect Google rankings?
Google has not confirmed bounce rate itself as a ranking factor. But Core Web Vitals and HTTPS, which shape bounce rate, are confirmed ranking signals. A slow page that keeps visitors from converting can also cut into your email signup conversion rate, since visitors who leave fast never see the form.
Next Step: Check Your Slowest Page Before You Rewrite Anything
Bounce rate drops fastest when you fix the right cause first. Start by checking the Largest Contentful Paint of your highest-traffic page today. If it is slow, fix that before touching the words. When it is already fast, compare Search Console clicks with bounce rate to look for a content mismatch instead.
For structured, hands-on practice with technical fixes like this, the Master Diploma in Digital & AI Marketing at Digital Marketing Skill Institute runs four AI-powered tracks, including AI-Powered WordPress and SEO Specialist, totalling ten courses, with a Full Stack option to complete all four.
It includes unlimited 1-on-1 coaching and mentoring and a U.S. Project Internship with a verified U.S. Work Reference Letter. The diploma is dual US and UK accredited and recognised in more than 100 countries.
The programme is fully online, so you can study from anywhere in your country. Browse more guides on the Digital Marketing Skill Institute blog, read real outcomes on reviews, or when you are ready, apply for the Master Diploma from the Digital Marketing Skill Institute homepage.
Every figure in this guide was checked against its original source before publication. Figures marked as illustrative are invented examples, not real results.
![9 Amazing Digital Marketing Skills to Make Money Online [With Proof]](https://digitalmarketingskill.com/wp-content/uploads/2019/07/9-Amazing-Digital-Marketing-Skills-to-Make-Money-Online-With-Proof-17.png)






