

toc items: 19
Open rate is the email marketing metric everyone reports. It is also the least trustworthy one. A privacy feature now auto-opens a huge share of messages. This guide explains which email marketing metrics actually predict revenue, and how to read each email marketing metric correctly.
Key Takeaways
- Apple’s Mail Privacy Protection affects roughly 55 to 60% of all email opens. Open rate alone can no longer be trusted as an engagement signal (Litmus Email Analytics, over 1 billion opens measured).
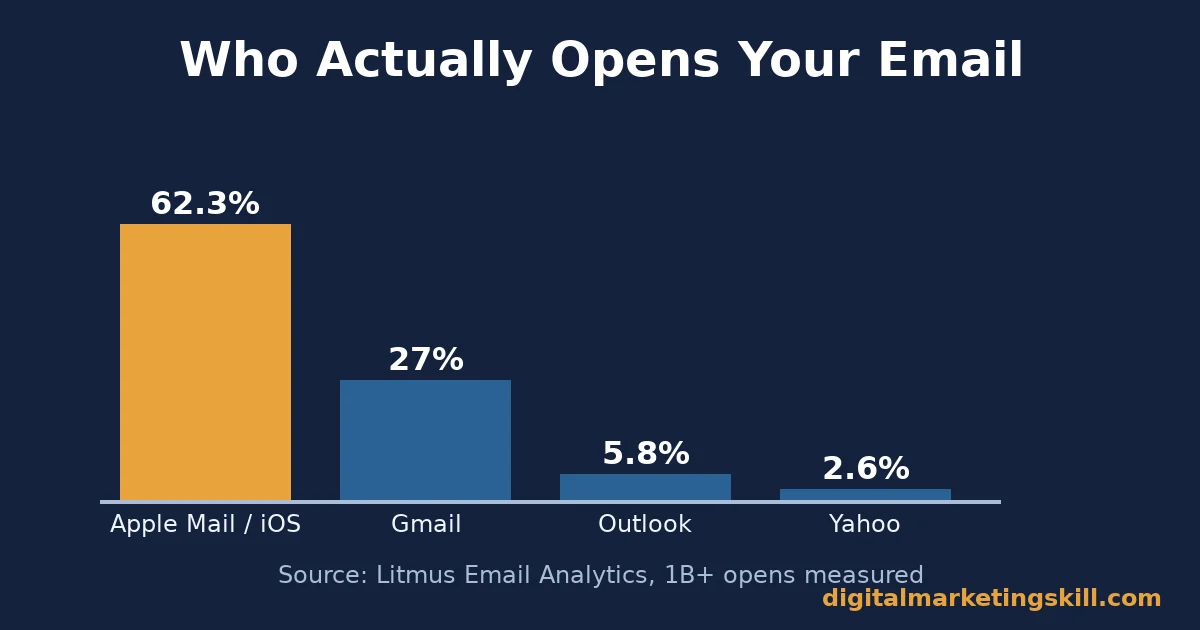
- Apple Mail and iOS together capture 62.26% of all email opens, versus 27.03% for Gmail. Testing mostly for Apple rendering matters more than most senders realize (Litmus). A template that breaks in Apple Mail quietly damages the majority of your audience’s experience, not a small edge case.
- The average email open rate across industries is 35.63%, and the average click rate is 2.62% (Mailchimp, billions of emails, campaigns of 1,000+ subscribers).
- The global average inbox placement rate is 87.2%. Nearly 13% of sent email never reaches the inbox at all, before anyone can open it (Validity).
- 35% of companies report $10 to $36 back for every $1 spent on email, and another 30% report $36 to $50 back (Litmus State of Email survey, roughly 500 marketing professionals).
In this guide
- The Open Rate Trap in Email Marketing
- How Each Email Marketing Metric Actually Works
- What Differs by Email Marketing Metric Type
- How to Track Each Email Marketing Metric Type Properly
- Measuring the Measurement: Which Email Marketing Metric Matters Most Right Now?
- The One Decision Rule: Never Judge a Campaign on Open Rate Alone
- A Real Email Marketing Case Worth Studying
- Frequently Asked Questions About Email Marketing Metrics
- Turn Email Marketing Metrics Into a Revenue Habit
The Open Rate Trap in Email Marketing
Most email marketing dashboards lead with open rate. It is the easiest number to report. It is also the number most distorted by forces outside your control, which makes it a poor headline metric even though almost every platform puts it front and center.
Apple’s Mail Privacy Protection automatically loads a tracking pixel for most Apple Mail users. It does this whether or not anyone actually looked at the email. That inflates recorded opens for any list with meaningful Apple Mail subscribers. Apple alone captures over 62% of opens, so this affects most lists.
Ground Rules Before You Trust a Metric
Treat any single email marketing metric as one signal, not the whole picture. A metric that looks great alone can still hide a real problem underneath it.
Before acting on a number, ask what it cannot tell you. This is the same discipline covered in more depth in a guide to marketing analytics generally. Email is simply one channel where the habit matters most.
With that limit in mind, here is the mechanism behind why some email marketing metrics mislead you. Then what differs between engagement and revenue metrics, how to track each type properly, and one decision rule for judging any campaign.
How Each Email Marketing Metric Actually Works
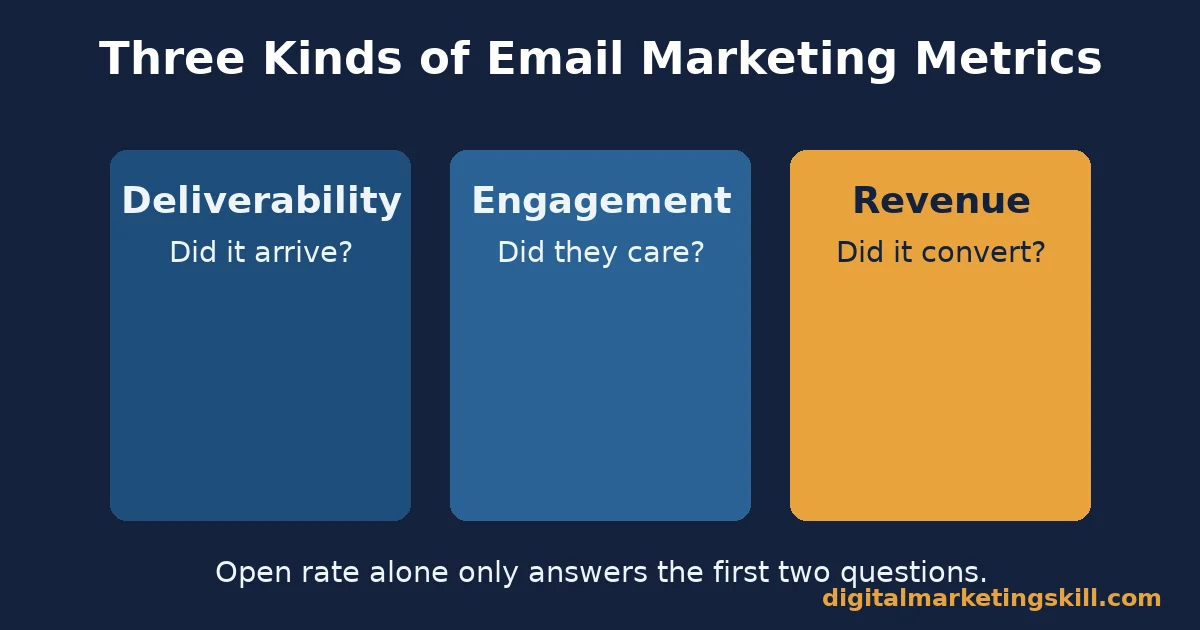
Every email marketing metric measures one of three things: whether the email arrived, whether someone engaged with it, or whether that engagement turned into revenue. Confusing the three is the most common measurement mistake.
Deliverability: Did It Arrive?
Deliverability asks whether your email reached the inbox at all. No engagement metric can even apply before that question is answered.
The global average inbox placement rate is 87.2%, according to Validity. Roughly one in eight sent emails never reaches an inbox. It lands in spam or gets blocked entirely instead. A campaign with a strong open rate but weak deliverability is often just a smaller, more engaged list seeing an email that most subscribers never got.
Deliverability problems rarely announce themselves clearly. A gradual decline in inbox placement can look, on the surface, like a gradual decline in open rate, which makes it easy to misdiagnose as a content problem when the real issue is reputation or authentication. Checking deliverability first, before touching subject lines or layout, avoids chasing the wrong fix for weeks.
Engagement: Did They Care?
Engagement metrics, including open rate and click rate, measure whether a delivered email captured attention.
Mailchimp’s own benchmark data, drawn from billions of emails sent to lists of 1,000 or more subscribers, puts the average open rate at 35.63% and the average click rate at 2.62%. Open rate is compromised by Apple’s privacy feature. Click rate is not affected the same way. That is why click-to-open rate is a more honest read of real engagement.
What Differs by Email Marketing Metric Type
Treating every metric the same way is a mistake. Vanity-adjacent metrics and revenue metrics need different handling, and a different review cadence.
Engagement Metrics: Built For Fast Feedback
Click rate, click-to-open rate, and unsubscribe rate respond within hours of a send. They are useful for quick subject-line and content tests. You want a fast read on what resonates.
They are a weak guide to revenue on their own. A highly clicked email does not always convert.
Revenue Metrics: Built For the Real Verdict
Revenue per email, conversion rate, and return on investment take longer to settle. Purchases do not always happen the moment someone clicks.
Litmus’s State of Email survey found that most companies report meaningful dollar returns. 35% land in the $10 to $36 per $1 range, and 30% land in the $36 to $50 range. These are the numbers that should decide whether a campaign gets repeated, not open rate. The same revenue-first thinking applies to B2B email marketing sequences, where a single deal can outweigh dozens of clicks.
List Growth: Built For the Long Game
Subscriber growth rate and list decay are easy to ignore, because neither one changes week to week in a dramatic way.
They matter anyway. A list that is not growing, or that is losing engaged subscribers faster than it gains new ones, will eventually show up as declining revenue per email, months after the real problem started. By the time the dashboard shows the damage clearly, the fix usually takes much longer than it would have earlier.
Review list growth on a monthly cycle, not a daily one. A single day’s number tells you almost nothing about the underlying trend.
Illustrative, invented numbers: a list gains 400 new subscribers in a month but loses 450 to unsubscribes and bounces. The net number is negative 50, even though the gross growth number looked healthy on its own. Reporting only the gross figure would have hidden a real, slow-moving problem building underneath a seemingly fine headline number.
How to Track Each Email Marketing Metric Type Properly
Once you know which category a metric belongs to, the tracking approach changes for each one.
Deliverability: Lead With Authentication and List Hygiene
Set up SPF, DKIM, and DMARC authentication before worrying about subject lines or send times. Remove addresses that have not opened or clicked in six months or more. This is the same hygiene principle covered in this guide to cold email marketing outreach lists.
A smaller, authenticated, engaged list reaches more inboxes than a larger, unverified one. This is true even though the larger list looks more impressive on a dashboard.
List Growth: Lead With a Monthly Net Number
Track net list growth once a month: new subscribers minus unsubscribes minus hard bounces, added together rather than reported as three separate, disconnected numbers. A positive net number does not guarantee a healthy list on its own, but a negative one is an early warning worth investigating closely before revenue per email starts to slide noticeably.
Engagement: Lead With Click-to-Open Rate
Calculate click-to-open rate: clicks divided by opens, not clicks divided by total sends. This divides out the inflated-open-rate problem. It compares clicks against whatever your open count happens to be, instead of treating open rate as reliable on its own.
A healthy click-to-open rate sits well above the raw click rate. It isolates people who engaged from people who were simply auto-opened.
Measuring the Measurement: Which Email Marketing Metric Matters Most Right Now?
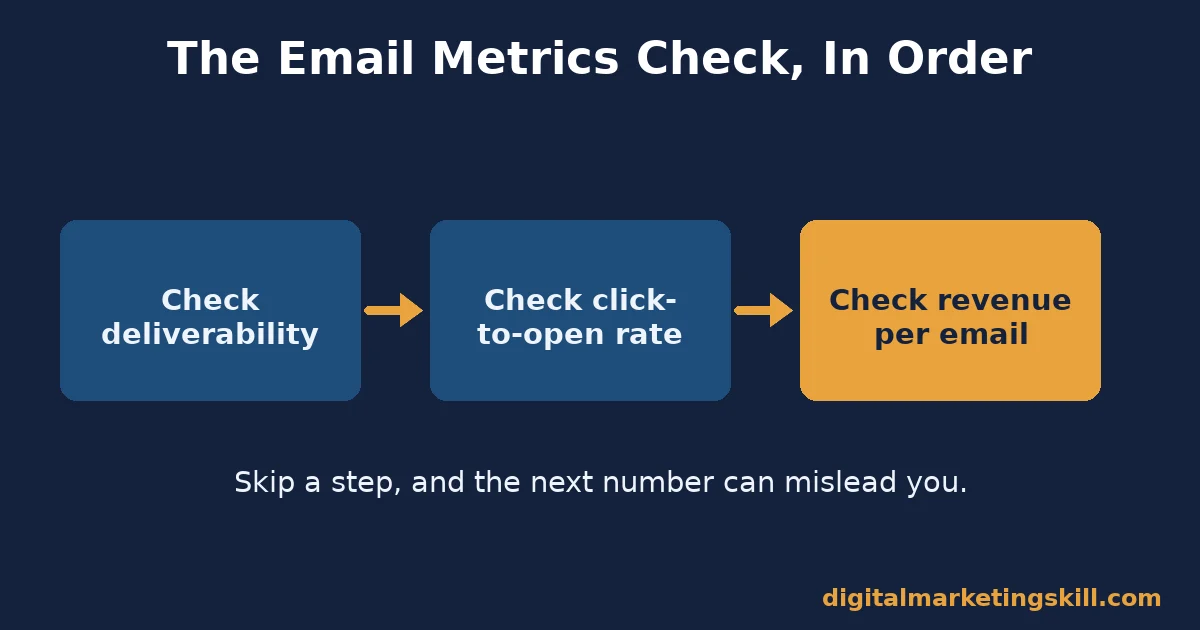
Three questions tell you which metric deserves your attention this week. This is not a fixed ranking that applies to every campaign:
- Is deliverability stable? If inbox placement is falling, fix that first. No engagement or revenue metric means anything if the email is not reaching the inbox.
- Is click-to-open rate moving? Once deliverability is stable, this is your fastest honest signal that content and subject lines are working.
- Is revenue per email holding steady or climbing? This is the number that ultimately justifies the whole program, even when the other two look fine.
Work through these three in order. Do not jump to revenue per email while deliverability is quietly declining underneath it. A shrinking inbox-reach number will eventually drag revenue down too.
Common Mistakes With Email Marketing Metrics
A few recurring mistakes quietly waste good email marketing data.
The first is comparing open rate across time periods that cover different Apple Mail adoption levels. A rising open rate can simply reflect more subscribers switching devices, not better content.
The second is treating a single send as a verdict on a whole strategy. One subject line test with a small list can produce noisy results that look meaningful but are not. Run the same test across several sends before trusting the pattern.
The third is ignoring list growth until revenue per email starts falling. By the time that number moves, the underlying list problem has usually existed for months already.
A fourth, quieter mistake is testing too many variables in one send: a new subject line, a new send time, and a new layout all at once. When the numbers move, nobody can say which change actually caused it. Change one variable at a time, even though it feels slower. The slower pace is what makes the next decision reliable instead of a guess dressed up as a conclusion.
The One Decision Rule: Never Judge a Campaign on Open Rate Alone
Before declaring any email campaign a win or a loss, check click-to-open rate and revenue per email, not just open rate. If those two disagree with what open rate suggests, trust them instead.
Illustrative, invented numbers to show the rule in practice: imagine a campaign shows a 45% open rate, well above average. That looks like a clear win.
But click-to-open rate comes in at only 4%, below the healthy range. Revenue per email is flat compared to the previous send.
Under the decision rule, this campaign is not a win. The high open rate was mostly a privacy feature auto-opening the email, not genuine interest. Subject line testing clearly worked here. The actual content inside did not.
A Real Email Marketing Case Worth Studying
A limit worth stating first: most published email marketing benchmarks are aggregated averages across huge numbers of senders. Your own list, industry, and audience can reasonably sit well above or below any of these figures without anything being wrong. Use industry averages as a rough compass, not a scoreboard you must beat every single send.
With that limit in mind, Litmus’s own market share tracking, based on more than a billion opens measured directly through Litmus Email Analytics, is a useful real-world anchor. Apple’s ecosystem alone accounts for 62.26% of opens, with Gmail second at 27.03%.
Any email marketing program that is not specifically tested for Apple Mail rendering is optimizing for a minority of its real audience. Testing a template in two or three major clients before every large send catches most rendering problems before they reach the whole list.
The pattern worth copying is not a specific subject line or send time. It is the habit of testing rendering against the platform your subscribers actually use. Track click-to-open rate against that platform too, rather than assuming all inboxes behave the same way.
This habit costs very little to build and pays off every single send afterward. A checklist of two or three email marketing metrics, reviewed in the same order every time, beats an impressive dashboard that nobody reads consistently.
Frequently Asked Questions About Email Marketing Metrics
Why did my email open rate suddenly jump without any change in content?
The most common cause is a shift in how many subscribers use Apple Mail, where privacy features auto-open messages. Check click-to-open rate and revenue per email before assuming the jump reflects real new interest.
What is a good click-to-open rate for email marketing?
There is no single number that fits every list.
A click-to-open rate meaningfully above your own historical average is always a stronger signal than any fixed industry benchmark figure. Track your own trend over time rather than chasing someone else’s number. A click-to-open rate that climbs quarter over quarter for your own list is a far more useful email marketing metric than matching an industry benchmark you have no context for.
Should I stop tracking open rate completely?
No. Open rate is still useful for spotting deliverability problems, such as a sudden drop that suggests emails are landing in spam. Just stop treating it as proof of genuine engagement on its own.
How often should email marketing metrics be reviewed?
Check deliverability and click-to-open rate right after every send. Review revenue per email on a slightly longer cycle. Purchases from a campaign can trickle in for several days after it goes out, especially for higher-priced products where buyers take time to decide.
Does list size matter more than engagement for email marketing metrics?
No. A smaller engaged list usually outperforms a larger unengaged one on every metric that matters. Mailbox providers also use engagement history to decide whether to deliver your future emails to the inbox. An unengaged list actively damages deliverability over time.
What is the biggest sign an email marketing metric is being misread?
A number that looks unusually good in isolation, with no corresponding change in revenue or real engagement elsewhere. Good news in one metric should usually show up somewhere else too. If it does not, treat the standout number as suspicious until you understand why it moved.
Can two email marketing metrics genuinely disagree with each other?
Yes. When they do, trust the metric closer to revenue. A rising open rate alongside flat revenue per email is a common disagreement, and it almost always means the open rate number is the misleading one.
What should a small business track if it only has time for one email marketing metric?
Revenue per email, if the list is large enough to make the number meaningful. It is the one metric that directly answers whether the program is worth the time it costs to run.
Can a high unsubscribe rate ever be a good sign?
Occasionally, yes. A spike right after you narrow your content toward a more specific, higher-value audience can mean uninterested subscribers are self-selecting out, which is a different situation entirely from a spike caused by a broken promise or spammy subject line.
Watch revenue per email over the following weeks. If it holds steady or improves, the unsubscribe spike was healthy list hygiene, not a content failure. A smaller, more interested list is usually worth more than a larger, indifferent one, even though the subscriber count going down can feel uncomfortable to report.
How do email marketing metrics differ between B2B and B2C campaigns?
B2B lists are usually smaller, with longer sales cycles, so revenue per email takes longer to show up, and conversion rate matters more than raw click volume. A single qualified reply can be worth more than a thousand opens. B2C lists are typically larger with faster purchase decisions, so engagement metrics like click-to-open rate give a more immediate read on what is working.
Is it worth paying for a dedicated deliverability monitoring tool?
For email marketing metrics on a list past a few thousand active subscribers, usually yes. A small drop in inbox placement is hard to spot from open rate alone, especially once Apple’s privacy feature is already inflating that number.
A dedicated tool catches the problem before revenue per email reveals it the hard way. For smaller lists, a manual monthly check of bounce rate and spam complaint rate covers most of the same ground without the extra cost.
How does segmentation affect email marketing metrics?
Segmented sends almost always beat one-size-fits-all blasts on the email marketing metrics that matter most, click-to-open rate and revenue per email, because the content actually matches what each group cares about. If your metrics look flat, testing a basic segment, such as recent buyers versus long-time subscribers, is often the fastest fix. Start with one simple split before building a complex segmentation scheme nobody has time to maintain.
What role does send time play in email marketing metrics?
Send time affects engagement metrics more than revenue metrics. A well-timed send can lift click-to-open rate noticeably, but a poorly timed send with strong content can still convert. Treat send time as a secondary lever, not the main one. Spend your testing effort on content and the offer itself first, and only fine-tune send time once those two are solid.
Turn Email Marketing Metrics Into a Revenue Habit
Reading email marketing metrics correctly is a skill you can learn step by step, anywhere in your country. The Digital Marketing Skill Institute’s Master Diploma in Digital & AI Marketing includes an AI-Powered Lead Generation and Email Automation track built around exactly this kind of measurement and campaign work.
Together, the four AI-powered tracks total ten courses, with a Full Stack option for completing all four. The program adds unlimited 1-on-1 coaching and mentoring and a U.S. Project Internship that comes with a verified U.S. Work Reference Letter. It is dual US and UK accredited and recognised in more than 100 countries, 100% online, so you can build this skill wherever you live.
See how the track maps to your own channel mix on the Master Diploma program page. Read real outcomes on the student reviews page, or browse more practical guides on the digital marketing blog. When you are ready, you can apply here.
Everything the Institute teaches is designed to work for marketers anywhere in your country, not just one region. Visit digitalmarketingskill.com to explore the full curriculum, or start from the homepage if you are still comparing options.
Every figure in this guide was checked against its original source before publication. Figures marked as illustrative are invented examples, not real results.
![9 Amazing Digital Marketing Skills to Make Money Online [With Proof]](https://digitalmarketingskill.com/wp-content/uploads/2019/07/9-Amazing-Digital-Marketing-Skills-to-Make-Money-Online-With-Proof-17.png)






