
toc items: 19
Most teams collect plenty of marketing analytics. Few actually use them to change a decision. This guide explains why that gap exists. It gives you a simple, practical way to close it in your own team, starting with your very next planning meeting.
Key Takeaways
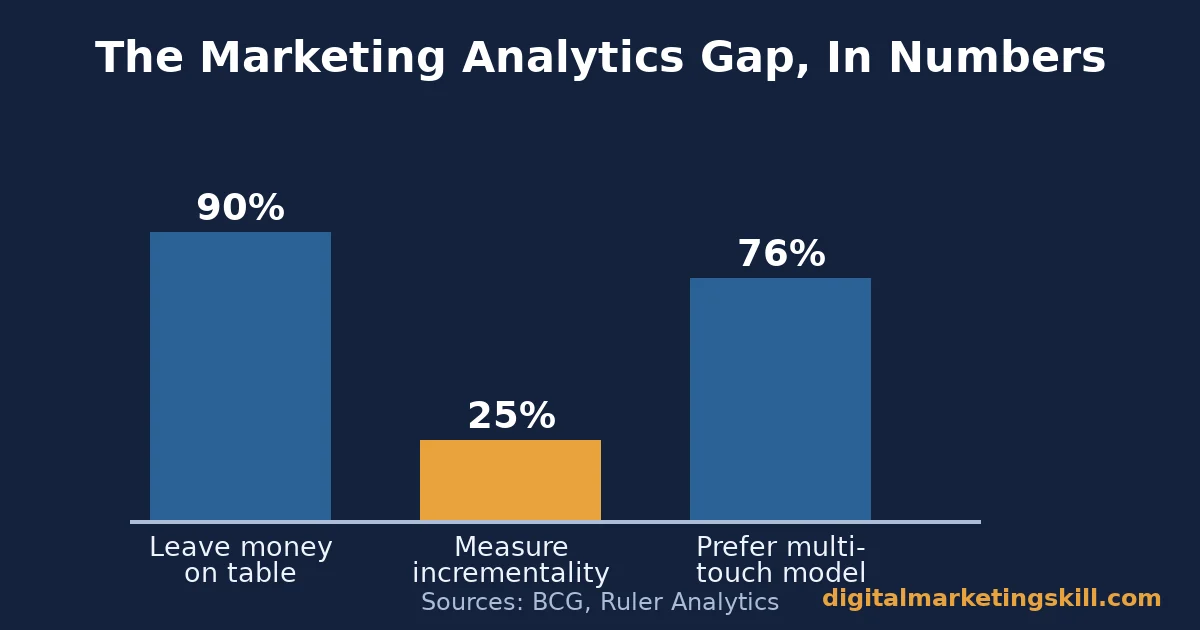
- 90% of marketers say they leave real money on the table because their measurement capability is not mature enough (BCG survey of 100+ CMOs managing close to $20 billion in combined budgets).
- Only 25% of marketers measure incrementality for most of their marketing activities, even though it is the clearest way to know what actually caused a result (BCG).
- Teams with mature measurement capability see a 20 to 40% improvement in spending efficiency (BCG).
- 75.5% of marketers prefer a multi-touch attribution model, yet 25.5% still rely on single-touch models that overstate one channel’s impact (Ruler Analytics).
- 87.5% of marketers say they trust their Google Analytics data, but only 63.5% actually base most decisions on it (Ruler Analytics). Trust and use are not the same thing.
In this guide
- What Marketing Analytics Actually Is
- Why Good Marketing Analytics Gets Ignored
- What Differs by Stage of Marketing Analytics
- How to Build Marketing Analytics That Actually Gets Used
- Measuring the Measurement: Is Your Analytics Actually Working?
- The One Decision Rule: No Dashboard Without a Decision Owner
- A Real Marketing Analytics Case Worth Studying
- Frequently Asked Questions About Marketing Analytics
- Turn Marketing Analytics Into a Skill You Actually Use
What Marketing Analytics Actually Is
Marketing analytics is the practice of collecting, measuring, and interpreting data about your marketing activity and customer behavior. The goal is better decisions. That is the textbook definition. In practice, most teams stop at the first two steps. They collect and measure. They rarely get to the decision.
That gap is the real subject of this guide. Dashboards are not the goal. A changed decision is the goal, built on the same data-driven marketing thinking covered elsewhere on this site, applied consistently rather than only when it is convenient.
The Dashboard Trap
BCG surveyed over 100 CMOs and senior marketing executives managing close to $20 billion in combined annual budgets.
90% said they were leaving real money on the table because their measurement capability was not mature enough. These are well-resourced teams, at large companies, with analytics tools already in place and skilled people running them. The problem was not a missing tool. It was a missing link between data and decision, the exact gap this guide is built to close.
Why Good Marketing Analytics Gets Ignored
Three things break the link between data and decision, and they compound each other.
Too Many Tools, No Single Story
Most teams run several analytics and automation tools at once. Each one tells a slightly different story about the same customer. Nobody owns reconciling them, so each department quietly trusts its own number and ignores the rest.
The result looks like analytics maturity from the outside. It behaves like several unrelated spreadsheets. Sales reports one pipeline number. Marketing reports a different conversion count for the same campaign. Finance has a third figure for cost per acquisition. Each team is technically correct, by its own tool’s definition. The meeting still ends in an argument instead of a decision.
Trust Without Use
Ruler Analytics found that 87.5% of marketers say they trust their data, specifically inside Google Analytics, which remains the most widely used web analytics tool. W3Techs’ survey of website technology puts Google Analytics on 46.8% of all websites it tracks, well ahead of any competing tool.
Trust is high. But only 63.5% of those same marketers say they base most of their decisions on it. People believe the number. They still do not act on it.
Correlation Mistaken for Causation
A dashboard can show that a channel correlates with sales. It cannot tell you the channel caused those sales, unless you test for it. That is what incrementality testing does: it holds a group back from a tactic and compares results, so correlation gets checked against a real counterfactual.
BCG found that only 25% of marketers measure incrementality for most of their activities. Most marketing analytics, in other words, never answers the one question that matters: would this have happened anyway?
What Differs by Stage of Marketing Analytics
Not every team needs the same kind of marketing analytics. The right stage depends on what decision you are actually trying to make.
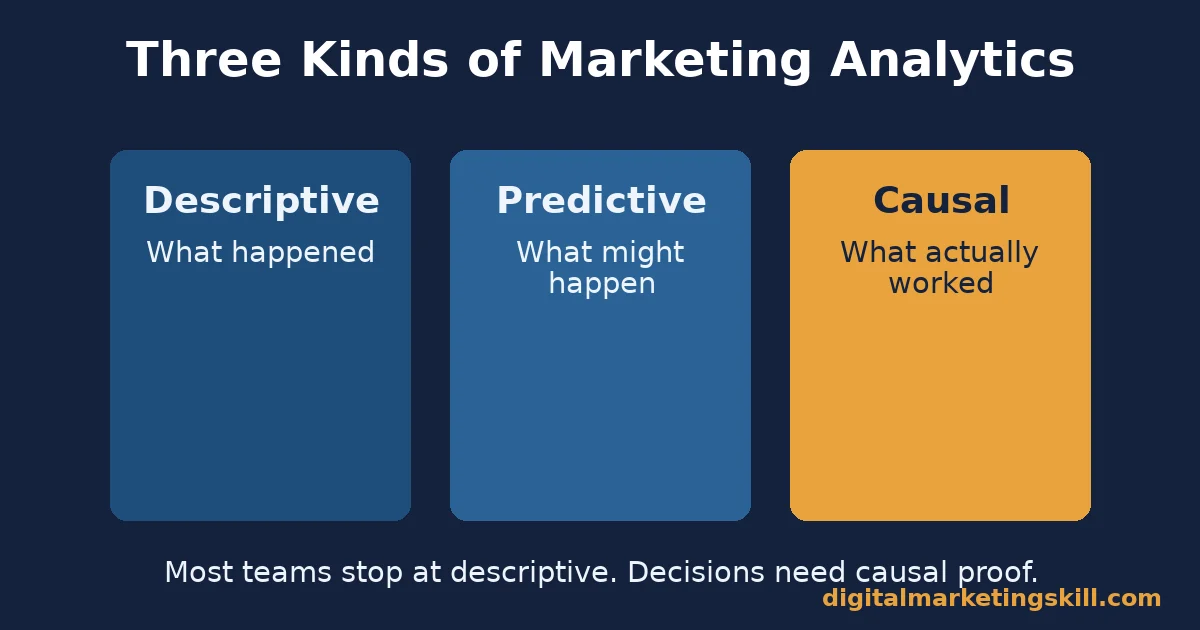
Descriptive Analytics: Built For Explaining the Past
Descriptive analytics summarizes what already happened: traffic, conversion rate, cost per lead, channel mix. It answers “what happened,” and nothing more. It is cheap to produce and easy to misuse, because a chart that explains the past quietly gets treated as a forecast of the future. Use it to monitor health, not to justify a big new bet.
Causal Analytics: Built For Proving What Worked
Causal methods, including incrementality tests and marketing mix modeling, isolate what a channel actually added, separate from what would have happened anyway. They cost more time and discipline to run.
They are the only category that can defend a budget decision under real scrutiny. A team that wants to reallocate serious budget needs this stage, not just a dashboard. Building that judgment is part of what a digital marketing strategist is actually responsible for.
Predictive Analytics: Built For What Comes Next
Predictive analytics uses past data to forecast a future outcome. Examples include which leads are likely to convert, or which customers are likely to churn. It sits between descriptive and causal work. A forecast is useful for planning, but it is still a correlation-based guess until you test the action it recommends.
Treat a predictive model’s output as a hypothesis worth testing, not a verdict worth acting on blindly. The teams that get the most value from predictive scores are the ones who still run a small causal check before betting real budget on the prediction.
Illustrative, invented numbers: a lead-scoring model predicts that leads scoring above 80 convert three times more often than average. Before expanding budget toward sourcing more high-score leads, a careful team runs a small test.
They spend extra budget on only a slice of high-score traffic, and check whether the actual conversion lift matches the model’s prediction. If it does, the budget shift is justified. If it does not, the model needs retraining before anyone commits real spend to it.
How to Build Marketing Analytics That Actually Gets Used
Treat the adoption problem, not just the measurement problem, and the plan looks different for each type of analytics.
Descriptive: Lead With One Shared Source
Pick one tool as the single source of truth for each core metric, and say so in writing. Every other tool can still run in the background. But when two numbers disagree, the named source wins the argument, not the loudest person in the room. This alone fixes most of the “too many tools” problem, without buying anything new.
Causal: Lead With One Small Test
Do not try to test every channel at once. Pick the single channel where you have the most budget at stake and the most internal disagreement about whether it works. Run one incrementality test or one controlled holdout on that channel first. A single credible test changes more minds than a year of dashboards, because it answers the causation question dashboards cannot.
Measuring the Measurement: Is Your Analytics Actually Working?
Three questions tell you whether your marketing analytics practice is working, separate from whether your campaigns are working:
- Decision rate: how many of your last ten significant marketing decisions cited a specific number from your analytics, by name. If you cannot list five, your dashboards are decoration.
- Disagreement rate: how often two tools or two teams report meaningfully different numbers for the same metric in the same meeting. A high rate means you have a reconciliation problem, not a tooling problem.
- Causal coverage: what share of your total budget has ever been tested for incrementality, even once. Most teams find this number is close to zero until they start tracking it on purpose.
Track these three numbers on a regular cadence. A marketing analytics practice that is actually working should show decision rate climbing and disagreement rate falling over time, even if the dashboards themselves barely change.
None of these three numbers requires new software to track. A simple shared note, updated after each major planning meeting, is enough to start. The discipline of writing them down consistently is what matters, not the specific tool used to record them.
Share these three numbers openly with the whole team, not only with the analytics function. When everyone can see that decision rate is climbing, they start citing real figures in meetings on their own, without being asked. That shift, more than any dashboard redesign, is what makes a marketing analytics practice stick.
Common Mistakes That Waste Good Marketing Analytics
Even teams with solid data make a few recurring mistakes that quietly cancel out their investment in marketing analytics.
The first is vanity metrics standing in for business metrics. A rising follower count or a high click-through rate feels like progress, but neither one reliably predicts revenue on its own. Tie every headline metric back to a dollar figure before presenting it as a win.
The second is comparing numbers across time periods that are not actually comparable, such as a seasonal sales spike against an ordinary period, without adjusting for the difference. The comparison looks dramatic. It is not useful for a decision, because the uplift came from the season, not the campaign.
The third is treating a short-term spike or dip as a trend before enough data has accumulated to tell the difference from normal noise. One good week does not prove a campaign works. One bad week does not prove it failed either. Wait for enough repeated observations before changing a strategy based on a single data point, no matter how good or bad that point looks on its own.
The One Decision Rule: No Dashboard Without a Decision Owner
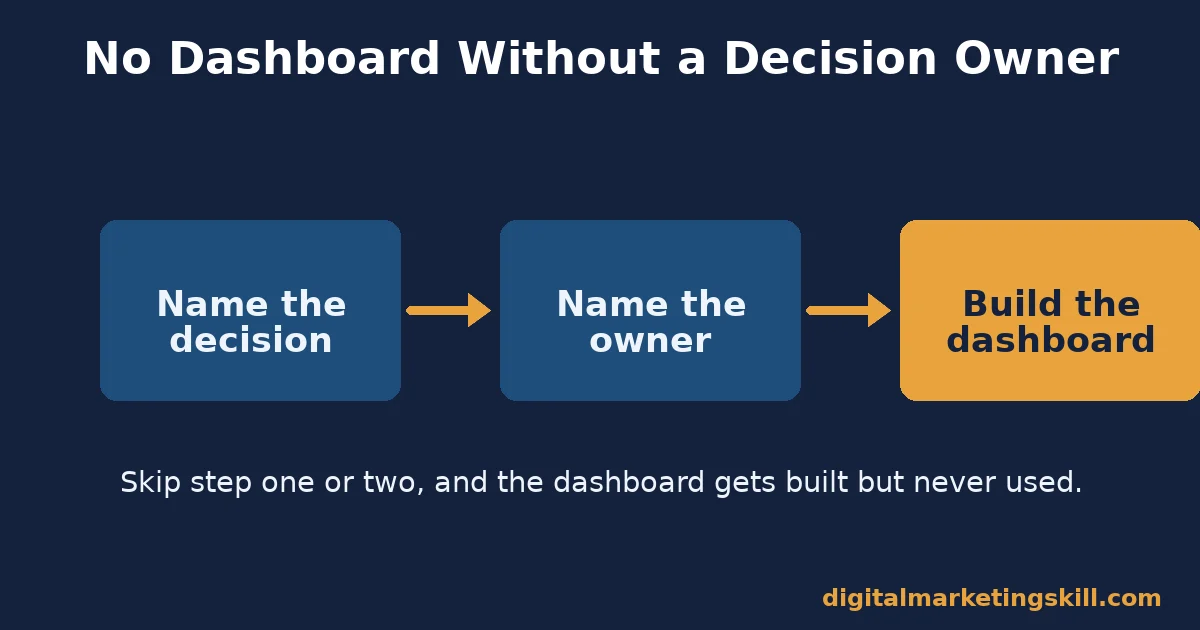
Before you build or request any new marketing analytics dashboard, name the specific decision it will inform and the specific person who owns that decision. If you cannot name both, do not build the dashboard yet.
Illustrative, invented numbers to show the rule in practice: imagine a team requests a new cross-channel attribution dashboard, estimated to take three weeks of analyst time to build. Under the decision rule, the requester first has to name the decision.
They land on “whether to shift 20% of paid social budget into email.” The decision owner is the growth lead. That single step cuts the build down to only the few metrics that decision actually needs, instead of the thirty metrics a generic dashboard would otherwise include by default.
A Real Marketing Analytics Case Worth Studying
A limit worth stating first: most published measurement case studies come from the research firm or the vendor that ran the project, with no independent audit confirming the numbers from the outside. They show what careful, well-resourced teams can achieve, not a typical result for every team.
With that limit in mind, BCG’s own research on marketing measurement found that companies which build real measurement capability see a 20 to 40% improvement in spending efficiency, drawn from its survey of CMOs managing close to $20 billion in combined budgets across seven consumer-facing industries.
The same research found that marketers who are required to submit performance metrics into annual strategic planning report far higher confidence in their own ROI process than marketers who are not required to.
The pattern worth copying is not a specific tool or model. It is the forcing function: when a team must submit real numbers into a real planning decision, measurement quality rises, because someone is finally going to act on it.
You do not need a $20 billion budget to copy that forcing function. A small team can create the same pressure by requiring one real number in every budget request, no matter how informal the process otherwise is.
Frequently Asked Questions About Marketing Analytics
What is the difference between marketing analytics and marketing reporting?
Reporting describes what happened. Marketing analytics asks why it happened and what to do next. A report can sit in an inbox unread. Analytics, done properly, ends in a decision someone actually makes.
Do small teams need incrementality testing, or is that only for large budgets?
Any team spending enough on one channel to feel pain if it stopped working can run a simple holdout test. You do not need a data science team. You need one channel, one control group, and the discipline to compare results honestly. Most teams already have the data sitting in whichever analytics tool they use daily; the gap is usually the test design, not the raw numbers.
Which marketing analytics tool should a beginner start with?
Start with whichever tool already captures your website and campaign data, and learn it well before adding a second one. Google Analytics remains the most widely used option by a wide margin, which also means the most tutorials and troubleshooting help exist for it. This beginner’s guide to Google Analytics is a reasonable place to start.
How often should a marketing analytics dashboard be reviewed?
Review cadence should match decision cadence, not a fixed calendar habit nobody questions. A dashboard tied to a weekly budget decision needs weekly review. A dashboard tied to an annual planning decision does not need daily attention from anyone on the team.
Why do two analytics tools often show different numbers for the same metric?
Different tools define sessions, conversions, and attribution windows differently, and they handle ad blockers and cookie consent differently too. Pick one tool as the named source of truth for each metric, rather than trying to force two tools to agree.
Is more marketing analytics data always better?
No. More data without a named decision and a named owner just adds noise and analyst hours. A smaller set of metrics that each map to a real decision beats a large dashboard nobody acts on.
Can marketing analytics replace human judgment entirely?
No, and teams that try to make it do so usually end up ignoring the data when it disagrees with a gut call anyway. Analytics narrows the range of reasonable decisions and rules out the clearly wrong ones.
A person still has to make the final call, weigh context the data cannot capture, and own the outcome. Treat the output as one strong input among several, not the entire decision on its own.
How long does it take to build a marketing analytics practice people actually trust?
Longer than most teams expect, often several review cycles in a row, because trust comes from a track record of correct calls, not from a better-looking dashboard alone. Start with one reliable metric tied to one real decision, get that right consistently, and expand from there rather than trying to fix everything at once.
What role does customer segmentation play in marketing analytics?
Segmentation groups customers by shared traits, such as behavior, value, or purchase history. It lets you tailor decisions to each group instead of treating every customer the same way. It is most useful when paired with a causal check: a segment that looks more valuable in a dashboard should also perform better in a real test, not just in historical averages.
What is the single biggest sign that a team’s analytics are not working?
Nobody can name the last decision a dashboard actually changed. If every recent budget call was made the same way it would have been made without the dashboard, the analytics are decoration, not infrastructure.
What should a new marketing analytics hire actually be measured on?
Measure them on decisions influenced, not dashboards shipped. A hire who builds five dashboards nobody uses has produced less value than one who builds a single report that changes a real budget call. Set that expectation from the first week, not after a year of unread reports. Write it into the job description itself. That way the expectation is clear before anyone is hired, not negotiated after the fact.
Should marketing analytics live with the marketing team or a separate data team?
Either can work, as long as one named person on the marketing side owns translating numbers into decisions. A central data team can build the pipes and the dashboards. Someone inside marketing still has to be the one who says what the numbers mean for next quarter’s plan.
What is a reasonable first incrementality test for a team that has never run one?
Pick your single largest paid channel, hold back 10 to 20% of spend in a comparable region or audience segment for a few weeks, and compare results against the rest. Keep the test simple enough to explain in one sentence, or nobody downstream will trust the result enough to act on it.
Turn Marketing Analytics Into a Skill You Actually Use
Building a marketing analytics practice that gets used, not just built, is a skill you can learn step by step, anywhere in your country. The Digital Marketing Skill Institute’s Master Diploma in Digital & AI Marketing includes an AI-Powered Google Specialist track built around exactly this kind of measurement work, alongside AI-Powered Lead Generation and Email Automation for teams that need to connect analytics to pipeline.
Together, the four AI-powered tracks total ten courses, with a Full Stack option for completing all four. The program adds unlimited 1-on-1 coaching and mentoring and a U.S. Project Internship that comes with a verified U.S. Work Reference Letter. It is dual US and UK accredited and recognised in more than 100 countries, 100% online, so you can build real analytics skill wherever you live.
See how the tracks map to your own role on the Master Diploma program page. Read real outcomes on the student reviews page, or browse more practical guides on the digital marketing blog. When you are ready, you can apply here.
Everything the Institute teaches is designed to work for marketers anywhere in your country, not just one region. Visit digitalmarketingskill.com to explore the full curriculum, or start from the homepage if you are still comparing options.
Every figure in this guide was checked against its original source before publication. Figures marked as illustrative are invented examples, not real results.
![9 Amazing Digital Marketing Skills to Make Money Online [With Proof]](https://digitalmarketingskill.com/wp-content/uploads/2019/07/9-Amazing-Digital-Marketing-Skills-to-Make-Money-Online-With-Proof-17.png)






