Facebook ad conversion rate improves fastest when you fix whichever lever is furthest below benchmark: creative, landing page or targeting. Most “best hacks” lists treat all three as equally urgent. That spreads your effort thin instead of fixing the one thing actually costing you conversions.
Key Takeaways
- Benchmarks exist, use them. A Triple Whale analysis of about 35,000 ad accounts found an average Facebook ad click-through rate of 2.19% and an average conversion rate of 1.60%.
- The auction rewards total value, not the highest bid. Meta ranks ads on a combination of bid, estimated action rate and ad quality. A cheaper, more relevant ad can beat a bigger budget.
- Relevance diagnostics are not an auction input. Meta’s own documentation states that ad relevance diagnostics are for troubleshooting, not inputs into the auction itself.
- Page speed moves conversion rate by itself. Google’s analysis of mobile landing pages found that cutting load time from 1.9 to 1.0 seconds raised conversion rate by 24%.
- Slow pages lose visitors before they ever see your offer. The same research found bounce probability rises 32% as load time goes from one to three seconds.
In this guide
- What Most Facebook Ad Conversion Advice Misses
- How the Facebook Ad Auction Actually Decides What You Pay
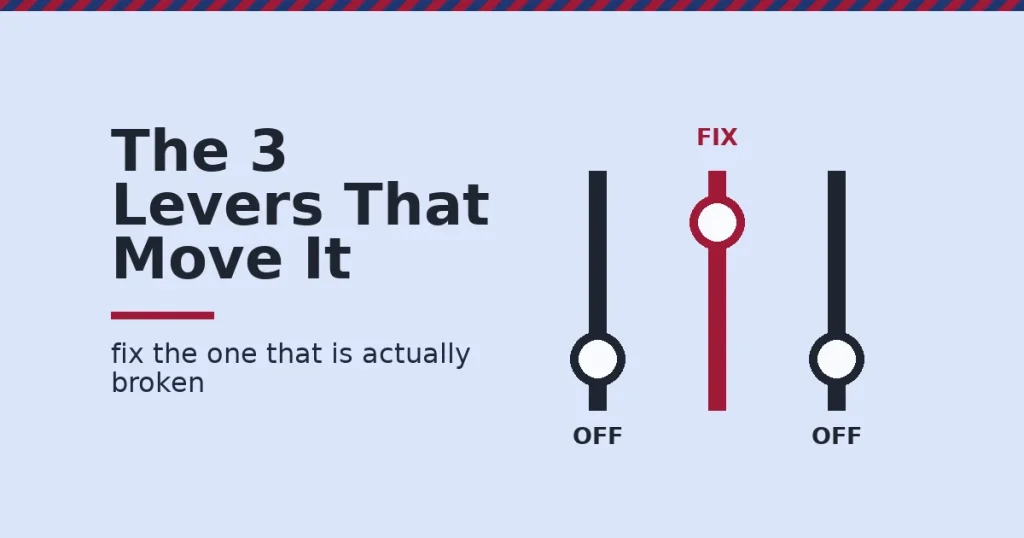
- The Three Levers That Actually Move Facebook Ad Conversion Rate
- How to Lead With Each Lever
- How to Measure What’s Actually Working
- The One Rule: Fix Whichever Metric Is Furthest Below Benchmark First
- A Real Case: What Google’s Landing Page Study Shows About Speed
- Frequently Asked Questions About Facebook Ad Conversion Rate
- Build the Skills Behind Every Lever on This List
What Most Facebook Ad Conversion Advice Misses
Most lists of Facebook ad conversion hacks give you ten tips with equal weight. Target the right audience. Write better copy. Use urgency. Test your creative. None of it says which one to fix first when your conversion rate is already low.
This guide sorts the real levers into three groups: creative, landing page and targeting. It explains what each lever actually controls. Then it gives you one rule for deciding which to fix first, based on your own numbers. The goal is to stop guessing and start diagnosing, since the same symptom, a weak Facebook ad conversion rate, can come from three completely different causes.
A few ground rules. The Triple Whale benchmark is one analytics firm’s dataset, not a universal number. Compare your trend over time more than the exact figure. Meta’s own auction documentation never publishes the precise formula or weights behind “total value.” Treat the model below as an informed, publicly documented approximation, not an exact recipe. No tactic below guarantees a result.
How the Facebook Ad Auction Actually Decides What You Pay
Meta does not simply sell the impression to the highest bidder. It ranks every eligible ad by total value. That is a combination of your bid, Meta’s estimate of how likely a person is to act on your ad, and an ad quality score. The ad with the highest combined total value wins the impression.
That structure means a lower bid can beat a higher one. If your ad is more relevant to the person seeing it, Meta’s estimated action rate rises. That lifts your total value without raising your spend. This is why two advertisers targeting the same audience can pay very different prices for the same result.
This also explains a pattern many advertisers notice but rarely diagnose correctly: a campaign that performed well for weeks suddenly gets more expensive with no change on your end. Usually, a competitor with a more relevant ad entered the same auction, not Meta “punishing” your account. The fix is the same either way: improve your own ad’s relevance rather than simply raising your bid.
Why Relevance Diagnostics Are Not What Most People Think
Meta replaced the old single relevance score with three separate rankings: Quality Ranking, Engagement Rate Ranking and Conversion Rate Ranking. Each compares your ad to others competing for the same audience.
Here is the part most advice gets wrong. Meta’s own help documentation states plainly that these diagnostics are a troubleshooting tool. They are not inputs into the auction itself. They tell you where a weak ad is likely losing performance, but they do not directly set your price. Diagnostics also only become available once an ad has at least 500 impressions, so a brand-new ad will show none at all.
The Three Levers That Actually Move Facebook Ad Conversion Rate
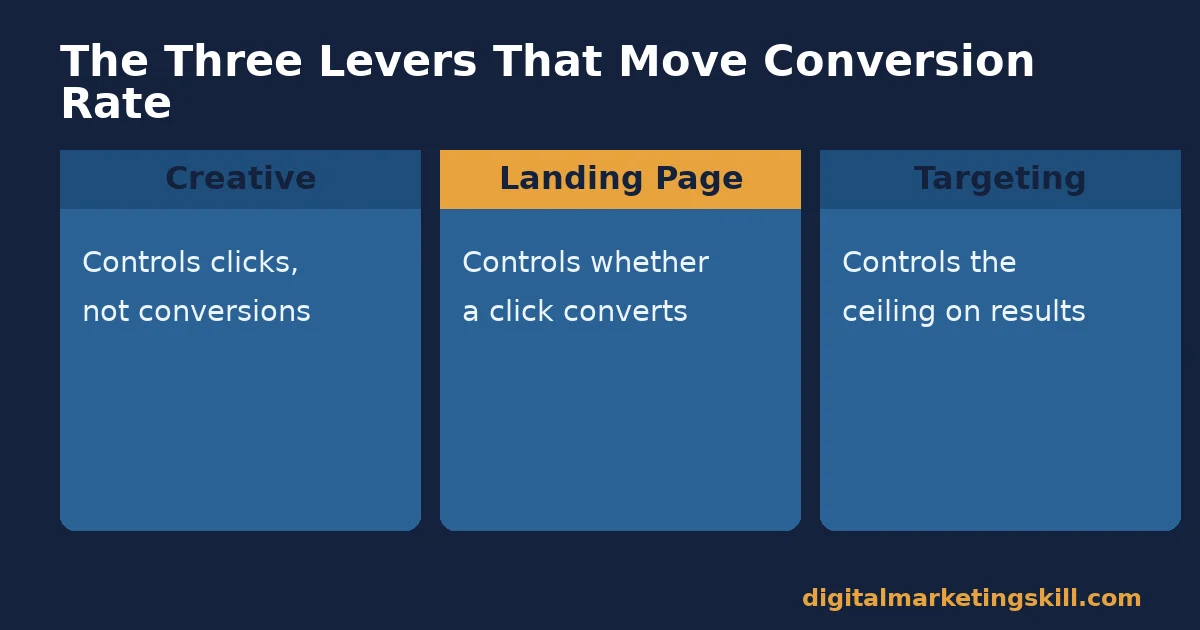
Below are the three real levers behind Facebook ad conversion rate. Each affects a different part of the path from impression to conversion.
Creative: Built to Earn the Click, Not Just the Impression
Your image or video, plus the ad copy around it, decides whether someone stops scrolling. Creative controls your click-through rate far more than it controls what happens after the click. A strong creative with a weak landing page still converts poorly, because creative only gets a person to the door.
Meta itself names three core ad elements: the image or video, the text, and the call-to-action button. All three need to point at the same promise. Otherwise the click you earn will not convert once the person arrives.
Creative fatigue is a related, often-missed cause of a falling click-through rate. Meta’s own creative fatigue recommendations note that the same creative shown repeatedly to the same audience naturally loses performance over time, which is one reason a conversion rate drop is not always a targeting or landing page problem.
Landing Page: Built to Finish What the Ad Started
The landing page is where Facebook ad conversion rate is actually decided. A click only becomes a conversion if the page delivers what the ad promised. It must also load fast enough to be seen, and make the next step obvious.
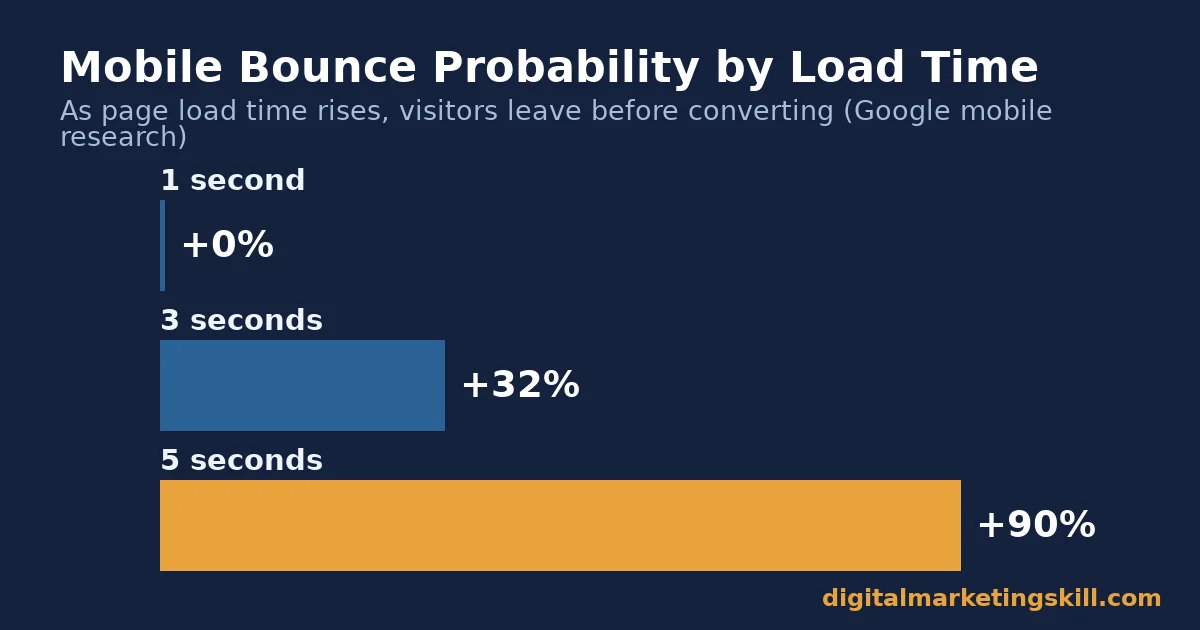
Speed alone moves the number. Google’s study of mobile landing pages found that bounce probability rises 32% as load time goes from one second to three seconds. At five seconds, it reaches 90%. A page that never finishes loading cannot convert anyone, no matter how good the ad was.
Targeting: Built to Lower Your Cost Per Result
Targeting decides who sees the ad at all. That sets a ceiling on how good your conversion rate can get. A perfectly built ad shown to the wrong audience will still underperform. No creative or landing page fix can repair a mismatched audience.
Narrower, warmer audiences convert more predictably than broad cold audiences, because they already know your brand and need less persuasion to act. Think of people who already visited your site, or looked at a specific page. That is also why a custom or lookalike audience often costs less per result than an identical ad shown to a broad, unqualified audience.
Targeting mistakes are also the hardest to diagnose from the outside, because a targeting problem often looks identical to a creative or landing page problem in your reports. A low Facebook ad conversion rate caused by the wrong audience will not improve no matter how many times you redesign the ad or rebuild the page, which is why ruling out targeting early saves real time.
How to Lead With Each Lever
Once you know which lever is weakest, the fix for each one is different. These three sections mirror the three levers above.
Creative: Lead With Copy That Matches the Image
Write the ad copy after you pick the creative, not before. The words should reinforce exactly what the image or video shows. Keep the text short enough to read in a glance. End with one clear call-to-action rather than several competing ones.
Test one variable at a time. Changing the image, the headline and the call-to-action together in one test leaves you unable to tell which change actually moved your Facebook ad conversion rate.
Landing Page: Lead With a Page That Matches the Ad’s Promise
Send traffic to a page that mirrors the ad’s exact offer, not your generic homepage. A visitor who clicked a specific promise and lands on an unrelated page leaves within seconds. That drop-off also quietly damages your Conversion Rate Ranking over time.
Fix load speed before you fix page copy. A beautifully written page that takes five seconds to load will still lose most of its visitors. They leave before they read a single word, based on the bounce-rate research above.
Targeting: Lead With Retargeting Before Cold Audiences
Build a retargeting audience first, from people who already visited your site or engaged with your Page. Do this before you scale spend on cold audiences. Warm audiences convert at a more predictable rate, which gives you a reliable baseline before you test unfamiliar, colder traffic.
Once retargeting is profitable, use a lookalike audience built from your best converters, not from everyone who ever clicked. A lookalike built from low-quality traffic will simply find you more low-quality traffic.
Meta’s own documentation on how lookalike audiences work confirms this logic: Meta builds the lookalike from your source audience, such as a custom audience or your conversion pixel’s purchasers, and finds new people who share similar traits. A source built from actual buyers produces a fundamentally different lookalike than a source built from casual page visitors.
How to Measure What’s Actually Working
Each lever has its own signal. Tracking the wrong one hides which lever needs attention.
- Click-through rate is the share of people who see your ad and click it. It mostly reflects creative, since targeting and landing page cannot affect a click that has not happened yet.
- Cost per click is what you pay for each click. It reflects both your bid and your total value in the auction. A rising cost per click with a flat click-through rate often signals a targeting or quality problem.
- Facebook ad conversion rate is the share of clicks that complete your desired action. It mostly reflects the landing page and the match between the ad’s promise and what the page delivers.
- Cost per result is your total spend divided by conversions. It is the number that actually matters for budget decisions. A cheap click that never converts is not a cheap result.
- Quality Ranking compares your ad’s perceived quality to others competing for the same audience, based on signals like hides and negative feedback. A falling Quality Ranking often predicts a rising cost per result before the cost actually rises.
How to Read These Numbers Together
Read these together, not alone. A high click-through rate with a low Facebook ad conversion rate points at the landing page, not the ad. A low click-through rate with good landing page conversion points at the creative, not the offer.
Check these numbers weekly rather than daily for most accounts. Facebook ad conversion rate can swing noticeably from one day to the next on modest budgets, simply from small sample sizes, and reacting to that noise wastes effort that would be better spent on a real fix.
The One Rule: Fix Whichever Metric Is Furthest Below Benchmark First
If there is one decision rule for improving Facebook ad conversion rate, it is this. Compare your click-through rate, your conversion rate and your cost per result against your own account history and published benchmarks. Then fix whichever one sits furthest below where it should be. Do not rewrite your creative because a landing page problem is the real cause.
Here is an illustrative example with invented numbers. Imagine an account with a 2.3% click-through rate, right around benchmark. But its Facebook ad conversion rate is 0.4%, far below the 1.60% average.
That gap points squarely at the landing page or the targeting, not the ad creative. A tempting first instinct might be to redesign the ad, but the numbers say otherwise.
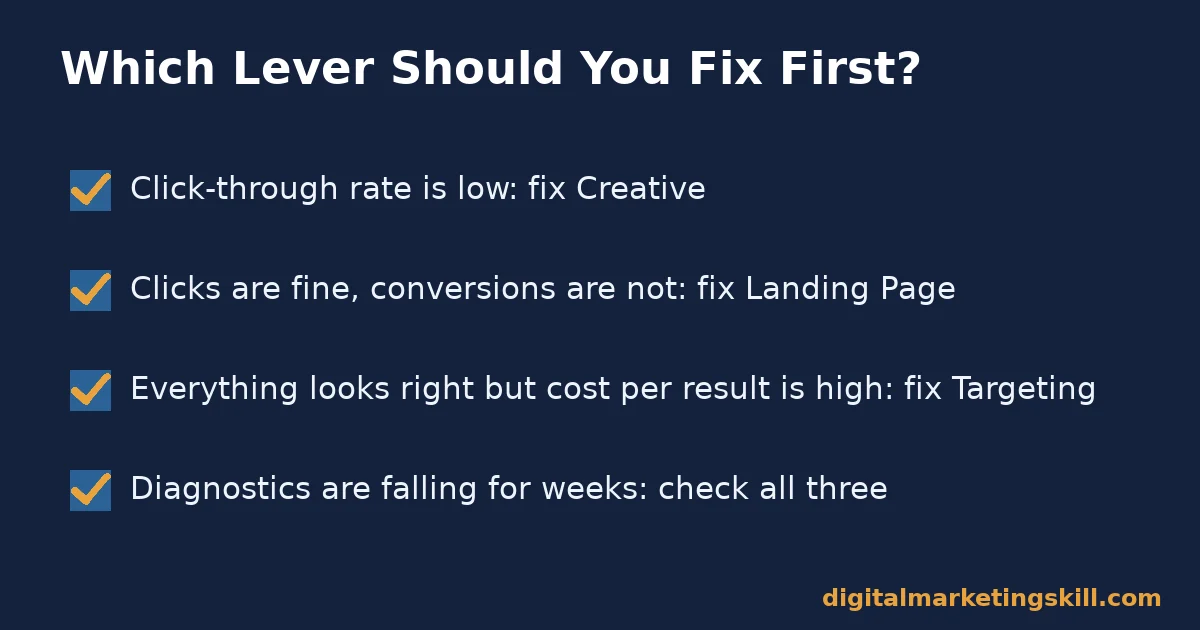
Run this same comparison every time results slip, not just once. The lever that was holding you back last month is not always the same lever holding you back this month, since fixing one bottleneck often reveals the next one.
A Real Case: What Google’s Landing Page Study Shows About Speed
Google’s own research on mobile landing pages analyzed page speed data at scale. It drew on a large sample of real mobile ad landing pages, and built a model that predicted bounce behavior with high accuracy from page-level metrics alone.
The headline findings were stark. A one-second increase in load time, from one to three seconds, raised bounce probability by 32%. Separately, cutting load time from 1.9 seconds to 1.0 seconds on a slower connection raised conversion rate by 24%, with no other change to the page.
The limit on this research matters. It is a large-scale statistical study across many sites and industries, not a single company’s A/B test. It shows a strong general pattern, not a guaranteed result for any one landing page. Your own page’s starting speed, industry and offer will all affect how much a speed fix is worth to you.
The practical takeaway is still clear. If your landing page is slow, fixing that single issue is likely to move your Facebook ad conversion rate more reliably than any amount of creative testing, simply because speed affects every visitor, while a creative change only affects people who have not yet seen your ad.
Frequently Asked Questions About Facebook Ad Conversion Rate
What is a good Facebook ad conversion rate?
Around 1.60% was the average across roughly 35,000 ad accounts in the Triple Whale analysis cited above. But averages vary widely by industry and campaign objective. Compare your own rate against your account’s history and your specific industry’s benchmark, rather than a single platform-wide number.
What is the fastest way to improve Facebook ad conversion rate?
For most accounts, fixing landing page speed is the fastest win. It requires no new creative or audience research, and the research above shows a direct, measurable link between load time and conversion rate. A simple first check is loading your own landing page on a phone over mobile data, not office Wi-Fi, since that is closer to the experience most of your actual visitors have.
Does a higher relevance score lower my ad costs?
Not directly. Meta’s own documentation states ad relevance diagnostics are not inputs into the auction. They correlate with cost because the same underlying ad quality that improves your diagnostics also improves your total value in the auction. But the diagnostics themselves are a troubleshooting report, not a lever you pull.
Does spending more money improve Facebook ad conversion rate?
Not by itself. Budget affects how many people see your ad, not how well your creative, landing page and targeting work together. A larger budget spent on a mismatched creative-to-landing-page combination simply loses money faster. Fix the weakest lever first, then scale budget once the combination actually converts.
Why does a brand-new ad convert worse than an older one?
A new ad has no relevance diagnostics yet, since Meta needs at least 500 impressions before diagnostics appear. Meta’s estimate of your ad’s action rate is also still learning from limited data. Performance commonly improves over the first days as Meta’s estimates become more accurate.
How long should I run a Facebook ad conversion rate test before judging it?
Give a new ad enough spend and time to clear the 500-impression threshold where diagnostics become available, and ideally several days beyond that. Early performance is often noisier than the eventual stable rate.
Judging a test after a few hours risks reacting to Meta’s still-learning estimates rather than real performance. A short test window is one of the most common, and most avoidable, reasons advertisers kill a perfectly good ad too early.
Should I target cold audiences or retargeting audiences first?
Start with retargeting if you have enough past visitors to reach a meaningful audience size. Warm audiences convert more predictably and give you a reliable benchmark. Expand to cold or lookalike audiences once that baseline is profitable. If your site traffic is too small for a useful retargeting audience yet, a tightly defined cold audience with strong creative is a reasonable place to start instead.
Build the Skills Behind Every Lever on This List
Creative, landing pages and targeting are not separate skills, even though this guide covered them one at a time to make each one diagnosable. In practice they interact constantly. Improving Facebook ad conversion rate usually means working on more than one at once.
The Master Diploma in Digital & AI Marketing at Digital Marketing Skill Institute teaches all three together, across four AI-powered tracks built from ten courses: AI-Powered Social Media Management and Advertising, AI-Powered Lead Generation and Email Automation, AI-Powered Google Specialist, and AI-Powered WordPress and SEO Specialist, with a Full Stack option for completing all four.
Every track includes unlimited 1-on-1 coaching and mentoring, plus a U.S. Project Internship with a verified U.S. Work Reference Letter. The diploma is dual US and UK accredited, and recognised in more than 100 countries.
It is 100% online, so you can apply what you learn anywhere in your country. Our guide on setting up Facebook for business marketing is a good next read if targeting is your weak lever. Our guide to identifying your target audience covers the groundwork every lever above depends on.
Your Next Step
See the full curriculum on the Master Diploma program page, browse more guides on the blog, read real outcomes on the reviews page, and when you are ready, apply here. No tactic on this page is a guaranteed result, so measure before you rebuild. See our earnings disclaimer for more on that, and visit digitalmarketingskill.com to see the full range of tracks.
Every figure in this guide was checked against its original source before publication. Figures marked as illustrative are invented examples, not real results.