
Instagram Stories are the short, full-screen photo and video posts that disappear from a profile after 24 hours. Most advice treats every Story the same way. In practice, image, video, and sticker-based Stories perform differently. Picking the wrong one for your goal wastes the one thing Stories cannot get back: a viewer’s attention before they swipe away.
Key Takeaways
- Instagram reaches 1.74 billion users through advertising. That is about 21.3% of the world’s population and 31.3% of everyone online, per DataReportal.
- In a Social Insider analysis of 161,180 Instagram Stories, 23.8% of viewers exit on the very first slide, nearly one in four.
- Exit rate then settles between 12.5% and 15.7% by the ninth and fifteenth slides, so the biggest drop-off happens immediately, not gradually.
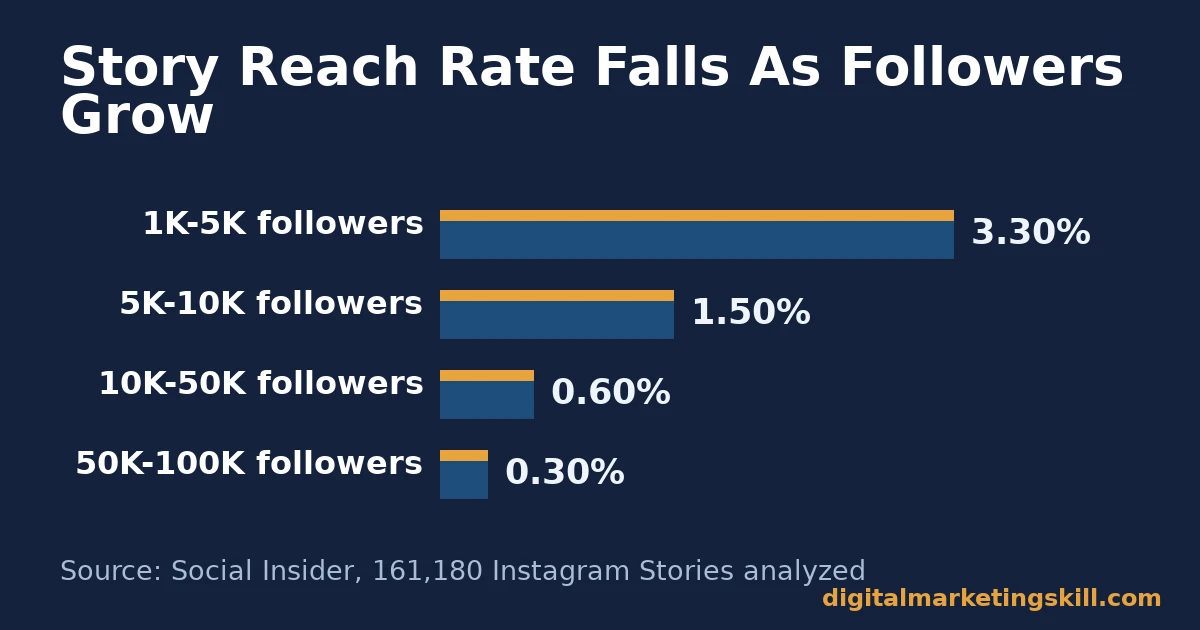
- Stories reach rate falls steeply as an account grows. It runs about 3.30% of followers for accounts with 1,000-5,000 followers. For accounts above 100,000 followers, it drops to roughly 0.25-0.30%.
- Tap-forward rate, how often viewers skip ahead rather than watch, ranges from about 50% to 66% depending on account size and format, per the same dataset.
In this guide
- The Instagram Stories Gap
- How Instagram Stories Actually Work
- Instagram Stories Reach By Account Size
- Where Instagram Stories Fit Among Platforms
- What Differs by Story Format
- How to Lead With Each Story Format
- Measuring Whether Your Instagram Stories Are Working
- The One Rule for Fixing Instagram Stories
- A Real Case: What 161,180 Stories Actually Showed
- Common Instagram Stories Mistakes to Avoid
- Frequently Asked Questions About Instagram Stories
- Build the Skills Behind Every Stories Strategy
The Instagram Stories Gap
Most Instagram Stories advice is a checklist: add a poll, tag a location, use a trending sticker. None of that explains why two accounts can follow the same checklist and get completely different results.
This guide is a framework based on published engagement data, not a formula that guarantees a result. Instagram’s algorithm and the platform’s own features change often. So treat every number here as a current benchmark, not a permanent rule. The exact figures will drift over time, even if the underlying pattern holds.
The ground rule is simple: a Story only works if it survives the first slide. Everything else, stickers, captions, links, only matters for the viewers who are still watching. A feed post lets someone scroll past slowly. A Story moves forward on its own unless the viewer acts.
Instagram itself frames Stories as a format for sharing everyday moments, separate from the polished, algorithm-ranked feed. That framing matters for strategy. A Story that looks too produced can feel out of place next to the casual content around it, even when the production quality is higher.
Knowing your target audience also changes which format earns that first slide. A Story built for an audience that already knows your brand can open differently than one built to introduce it to someone new.
How Instagram Stories Actually Work
An Instagram Story is a sequence of slides, shown full-screen, one after another. It continues until the viewer taps forward, taps back, swipes away, or the sequence ends. Each slide disappears from your profile after 24 hours unless you save it to a Highlight.
Three numbers decide how far a Story travels. Reach: how many of your followers, and non-followers, actually see it. Exit rate: how many viewers leave at each slide. Tap-forward rate: how many choose to skip ahead rather than watch to the end.
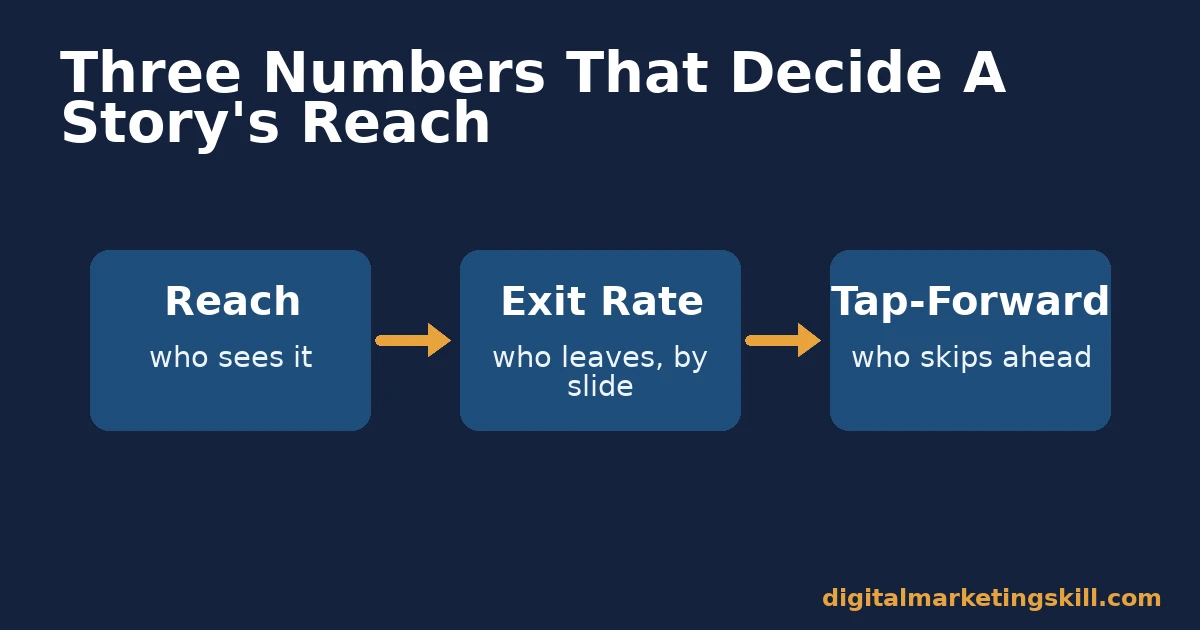
These three numbers interact. Strong reach paired with a weak first slide still fails, because most of that reach exits before slide two. A strong first slide paired with poor reach never gets the chance to prove it, because too few people see it at all.
Timing sits underneath all three as a fourth factor. Posting when your audience is active gets more of a Story’s reach in the first hour, which is also when Instagram’s own ranking signals respond most to early engagement.
That is why the rest of this guide treats format choice and measurement as one problem, not two separate topics.
Instagram Stories Reach By Account Size
Reach rate is not a fixed number. It shrinks as an account grows, which is the opposite of how many marketers expect a bigger following to behave.
In the Social Insider dataset, accounts with 1,000 to 5,000 followers saw roughly 3.3% of their followers view an average Story. That is a small fraction, but still far more than larger accounts see. Accounts with 50,000 to 100,000 followers saw closer to 0.3%. That is more than a tenfold drop, even though the larger account has far more total followers.
Instagram itself reaches a huge base to draw from: the platform’s advertising audience alone covers 1.74 billion users, about 21.3% of the world’s population. But that scale does not translate evenly down to any single account’s Story reach. Reach depends far more on relationship with existing followers than on the size of the platform overall.
The practical takeaway: do not benchmark your Stories against an account in a different size tier. A 2% reach rate might be disappointing for a small account and excellent for a large one.
Write your own reach rate down after each Story, even in a simple spreadsheet, and compare it against your own history rather than a borrowed target. A single Story tells you little; a pattern across ten or twenty tells you whether your current tier’s benchmark is realistic for your account.
Where Instagram Stories Fit Among Platforms
Instagram is not the single biggest platform by usage. DataReportal found that 54.6% of internet users aged 16 and over used Instagram in the past month, placing it third behind Facebook at 56.3% and YouTube at 55.3%.
That ranking matters for Stories specifically. A format built for an audience that already follows you works differently depending on the platform. On a platform fighting hard for broad discovery, existing relationships carry less weight. Instagram’s advertising audience also skews young. The 18-24 and 25-34 age brackets together make up roughly 64.6% of that audience, per DataReportal. That skews the tone which performs best in a Story.
None of this means Stories only work for brands targeting a younger audience. It means the format’s strength, a close, two-way relationship with people who already follow you, lines up naturally with a platform where repeat engagement already drives most of the activity.
Older audiences still use Instagram in large numbers; they simply make up a smaller share of the advertising base than younger ones do. A Story aimed at an older segment can still perform well, as long as the format matches how that specific audience actually engages, not an assumption borrowed from the platform average.
What Differs by Story Format
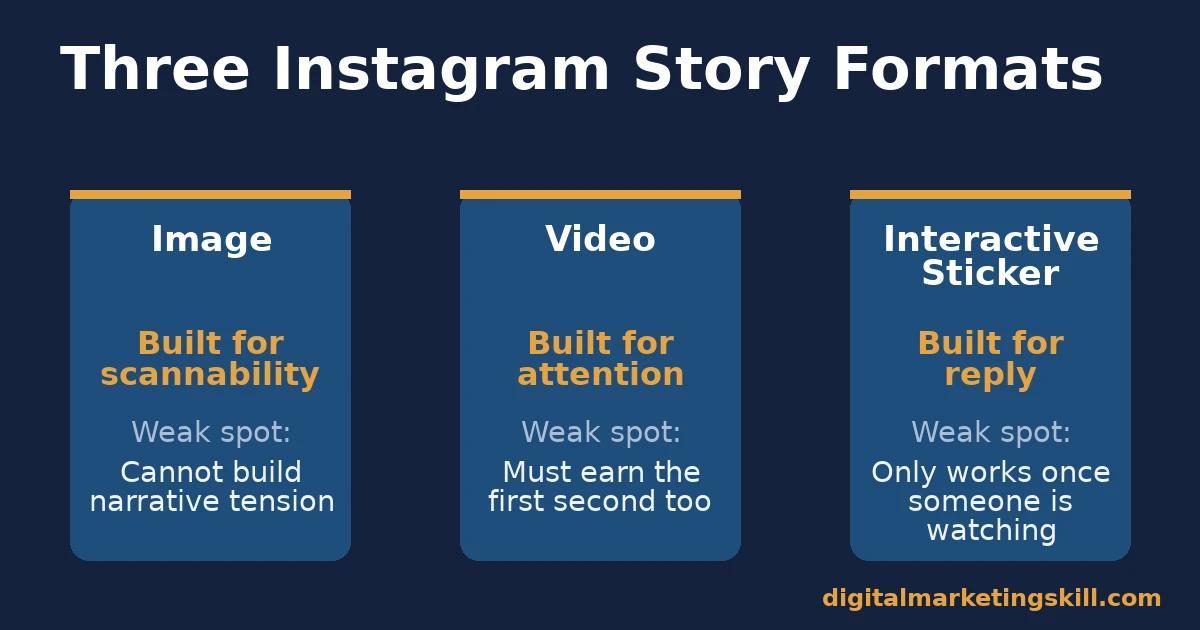
Three formats cover most Instagram Stories. Each tends to win a different part of the viewer’s attention, and each has a different weak spot.
Image Stories: Built For Scannability
A single photo slide, often with text or a sticker layered on top. Viewers process it in under a second, which makes it forgiving of a weak hook, since there is nothing to sit through.
Its weak spot is depth. An image slide cannot build the kind of narrative tension that keeps a viewer watching slide after slide. It works best as one slide in a sequence, not the whole Story.
Image Stories also tend to be the fastest format to produce, which matters for accounts posting daily. A quick image slide, published consistently, often beats an occasional polished video that takes long enough to produce that posting frequency drops.
Video Stories: Built For Attention
A short video clip, up to 60 seconds split across slides. Motion and sound earn more attention than a static image, when the first second gives the viewer a reason to keep watching.
Its weak spot is the same first second. Social Insider’s data shows video and image Stories have broadly similar exit rates at most follower tiers. Video’s extra production effort does not automatically buy a lower exit rate on its own.
That does not make video worthless. It means video earns its extra effort through watch time and message, not simply through being video. A video that repeats what an image could say in one frame rarely justifies the extra production time.
Interactive-Sticker Stories: Built For Reply
A poll, question, or quiz sticker placed on a photo or video slide, built using Instagram’s own sticker tools. These turn a one-way post into a two-way exchange. It is the only format of the three that asks the viewer to act, not just watch.
Its weak spot is reach. A sticker only works on a viewer who is already watching, so it cannot fix a Story that nobody saw in the first place. Instagram also offers a separate Questions sticker, built for open-ended replies rather than a fixed set of answers. It works well once a viewer already trusts the account enough to respond honestly.
Interactive stickers also work best sparingly. A Story packed with a poll, a quiz, and a question sticker all at once can feel like a survey rather than a conversation, which tends to lower completion rather than raise it.
How to Lead With Each Story Format
Picking a format is half the decision. Opening it correctly, for the specific weak spot each format has, is the other half.
Image Stories: Lead With Contrast
Open with a frame that looks different from the slide before it. Because viewers process an image slide almost instantly, visual contrast, not clever copy, is what earns the tap forward instead of the swipe away.
Keep text on the image short enough to read in under two seconds. A dense caption competes with the one-second processing window instead of using it.
Video Stories: Lead With the First Second
Start the clip already in motion, mid-action, instead of building up to it. The first second has to earn the second second, because that is exactly where the 23.8% first-slide exit rate gets decided.
Avoid a slow intro, logo animation, or title card as slide one. Save that for slide two, once the viewer has already chosen to keep watching.
Interactive-Sticker Stories: Lead With a Real Question
Ask something you genuinely do not know the answer to, not a rhetorical poll with an obvious “yes.” A real question gets a real tap, and real taps are what the Instagram algorithm reads as engagement.
Place the sticker on an early slide, not the last one. Viewers who already exited by slide three never see a sticker placed on slide seven.
Measuring Whether Your Instagram Stories Are Working
Four numbers, available in Instagram’s own Insights panel, cover most of what matters.
Reach rate is the share of your followers who saw the Story, out of your total follower count. Compare it to your own follower-size tier, since reach rate drops as accounts grow, not just against a single universal target.
Exit rate is the share of viewers who leave on a given slide. Read the first-slide number closely. If it sits well above roughly 24%, the opening slide, not the rest of the Story, is the problem to fix first.
Tap-forward rate is the share of viewers who skip ahead rather than watch a slide fully. A high tap-forward rate on a specific slide is a signal that slide is slower or less interesting than the one before it.
Reply rate is the share of viewers who send a direct message in response to the Story. Treat it as the clearest signal of real interest, since it requires more effort from the viewer than a tap or a view.
Track these four together, not in isolation. A Story with strong reach and a low exit rate but almost no replies is being watched, not acted on. That points to a different fix than a Story nobody is finishing.
The One Rule for Fixing Instagram Stories
Diagnose which number is actually broken before you change anything. If reach rate is below your follower tier’s benchmark, your problem is distribution, and no sticker or clever hook fixes that. If exit rate on slide one is high but reach is fine, your problem is the opening frame. When both numbers look healthy but replies stay flat, the problem is that nothing in the Story asked for a response.
Here is an illustrative, invented example of that rule in practice. Say an account with 20,000 followers sees a healthy 9% reach rate but a 35% first-slide exit rate, well above the 23.8% benchmark. Redesigning the sticker strategy would not fix this. The fix is a stronger opening frame, because the data shows the audience is already arriving; it just is not staying.
Treating every underperforming Story the same way wastes effort. Adding more stickers or posting more often fixes the wrong half of the funnel if distribution was never the issue.
A Real Case: What 161,180 Stories Actually Showed
The clearest evidence of how Instagram Stories really perform comes from Social Insider’s benchmark analysis, which examined 161,180 Instagram Stories posted by brand accounts.
That pattern held across nearly every follower tier: the sharpest exit happens on the very first slide, at 23.8%, and reach rate falls as an account’s follower count rises, from roughly 3.3% for the smallest accounts down to a fraction of a percent for accounts above 100,000 followers.
The limits matter here. This dataset covers brand accounts the tool already tracks, not a random sample of all Instagram users. The figures describe an average pattern across accounts, not a guarantee for any single one. Use it to set a realistic benchmark for your own account’s size, not as a target that applies identically to everyone.
Treat these benchmarks the way you would treat any industry average: a useful starting point for your own tracking, not a number to chase for its own sake. The account that matters most is your own, measured against its own history.
Common Instagram Stories Mistakes to Avoid
Three mistakes show up again and again, across every account size and format.
Treating every slide as equally important. The first slide carries most of the weight, since roughly a quarter of viewers leave there. Spending equal effort on slide one and slide six ignores where most of the audience actually is.
Copying a competitor’s format without their reach. A large account’s polished, multi-slide Story might work because it already has reach most small accounts do not. Copying the format without the underlying audience usually just copies the exit rate too.
Posting without checking the Insights panel. Reach rate, exit rate, and tap-forward rate are all available natively, slide by slide. Posting the next Story without reading the last one’s numbers means repeating a mistake you could have already caught.
Frequently Asked Questions About Instagram Stories
How many Instagram Stories should a business post per day?
There is no universal number. A more useful test is your own exit-rate trend. If later Stories in a daily sequence show a rising exit rate, you have likely posted more than your current audience wants to watch in one sitting.
Do Instagram Stories still matter if Reels get more reach?
Yes, for a different job. Reels tend to reach people who do not yet follow you. Stories are built for the audience that already does. That makes the two formats complementary, not competing for the same goal.
What is a good exit rate for Instagram Stories?
Treat the first-slide benchmark, about 24%, as a reference point rather than a pass-or-fail line. A first-slide exit rate noticeably above that is worth investigating before you look at any other part of the Story.
Why do my Instagram Stories get views but no replies?
Usually because nothing in the Story asks for a reply. A poll, question, or quiz sticker gives viewers an easy, low-effort way to respond; without one, most viewers will watch and move on.
Do Instagram Stories help with sales, not just engagement?
They can, when the Story includes a clear, specific next step, such as a link sticker or a direct call to action. A Story that ends on the content alone, with no stated action, rarely converts. Sprout Social reports that Story ads have run at a lower average cost-per-click than feed ads on the platform, which makes the format worth testing even on a modest budget.
How long should an Instagram Story sequence be?
Long enough to make the point, short enough to survive the exit-rate curve. Since exit rate climbs fastest in the first few slides and then levels off, a sequence of three to five slides usually captures most of the audience that a much longer one would lose anyway.
Does the order of slides in an Instagram Story matter?
Yes. Put your strongest visual or most important information in the first two slides, since that is where most of the audience is still watching. Save supporting detail, context, or a secondary call to action for later slides aimed at the smaller group who stay.
Should every Instagram Story include a sticker?
No. A sticker only helps once a viewer is already watching. A Story with weak reach or a weak opening slide needs that problem solved first, since a sticker cannot fix a distribution problem.
Build the Skills Behind Every Stories Strategy
Reading Instagram Stories data and matching the right format to the right goal is one piece of a much broader skill set, taught across the Digital Marketing Skill Institute’s Master Diploma in Digital & AI Marketing.
The program is built from four AI-powered tracks: AI-Powered Social Media Management and Advertising, AI-Powered Lead Generation and Email Automation, AI-Powered Google Specialist, and AI-Powered WordPress and SEO Specialist. Together, these total ten courses, with a Full Stack option for students who complete all four.
Every track includes unlimited 1-on-1 coaching and mentoring, a U.S. Project Internship with a verified U.S. Work Reference Letter, and dual US and UK accreditation recognised in more than 100 countries. The program runs 100% online, so you can build these skills from anywhere in your country.
See how Stories fit into a wider Instagram strategy, find more formats to test in this content ideas guide, or read how Stories support brand awareness more broadly. Read real outcomes on the reviews page, or go straight to the application page. Learn more about the Institute at digitalmarketingskill.com, or start your own program search from the homepage at any time.
Every figure in this guide was checked against its original source before publication. Figures marked as illustrative are invented examples, not real results.
![9 Amazing Digital Marketing Skills to Make Money Online [With Proof]](https://digitalmarketingskill.com/wp-content/uploads/2019/07/9-Amazing-Digital-Marketing-Skills-to-Make-Money-Online-With-Proof-17.png)






