
Marketing analytics tools built around one dashboard rarely answer the question that matters most: which channel is worth the next dollar. A single tool shows what happened on your own site. It does not show how that compares with competitors, other channels or a customer’s real lifetime value. This guide shows where a single-tool setup breaks, and what to add first.
Key Takeaways
- One tool dominates, but it is not the whole picture. Google Analytics runs on 47% of all websites and about 82% of the sites that use any traffic analysis tool, according to W3Techs, yet it cannot show how your numbers compare with competitors.
- The tool landscape keeps growing because no single tool covers everything. Chiefmartec’s own landscape count reached 14,106 marketing technology products, up 27.8% in a single year.
- Channel comparisons change decisions. Content Marketing Institute’s B2B research found organic search drives an estimated 44.6% of B2B revenue, the largest single channel, which a single on-site analytics tool cannot show without a second data source.
- Email often outperforms channels that get more attention. Litmus’s State of Email survey found 35% of marketing leaders report $10 to $36 back for every $1 spent on email, a return rarely visible in a general traffic dashboard.
- More tools do not automatically mean better decisions. The value comes from comparing a small, deliberate set of tools against each other, not from collecting more dashboards.
In this guide
- What Most Advice on Marketing Analytics Tools Gets Wrong
- Why One Analytics Tool Cannot Answer Every Question
- The Three Gaps a Single Analytics Tool Leaves Open
- How to Close Each Gap in Your Marketing Analytics Tools
- How to Measure Whether Extra Tools Are Worth Keeping
- The One Decision Rule: Add a Tool Only for a Named Question
- A Real Case: What “Peak Martech” Looks Like in Practice
- Frequently Asked Questions About Marketing Analytics Tools
- Start With the Question, Not the Tool
What Most Advice on Marketing Analytics Tools Gets Wrong
Most advice either tells you to trust your main analytics tool completely, or to buy every tool on a long list. Neither is right. A single tool, however good, only shows your own site. It shows that site in isolation, from one angle.
This guide explains three questions one tool cannot answer alone. It shows what a second or third tool adds for each. It also gives a simple way to decide when you genuinely need another tool, versus when you just need to use the one you have better.
A ground rule first. The figures below come from named, independently run studies and reports, each with its own method and limits. Read them as evidence from their own context, not a fixed formula. Which marketing analytics tools you actually need depends on your channels, your size and your budget.
Why One Analytics Tool Cannot Answer Every Question
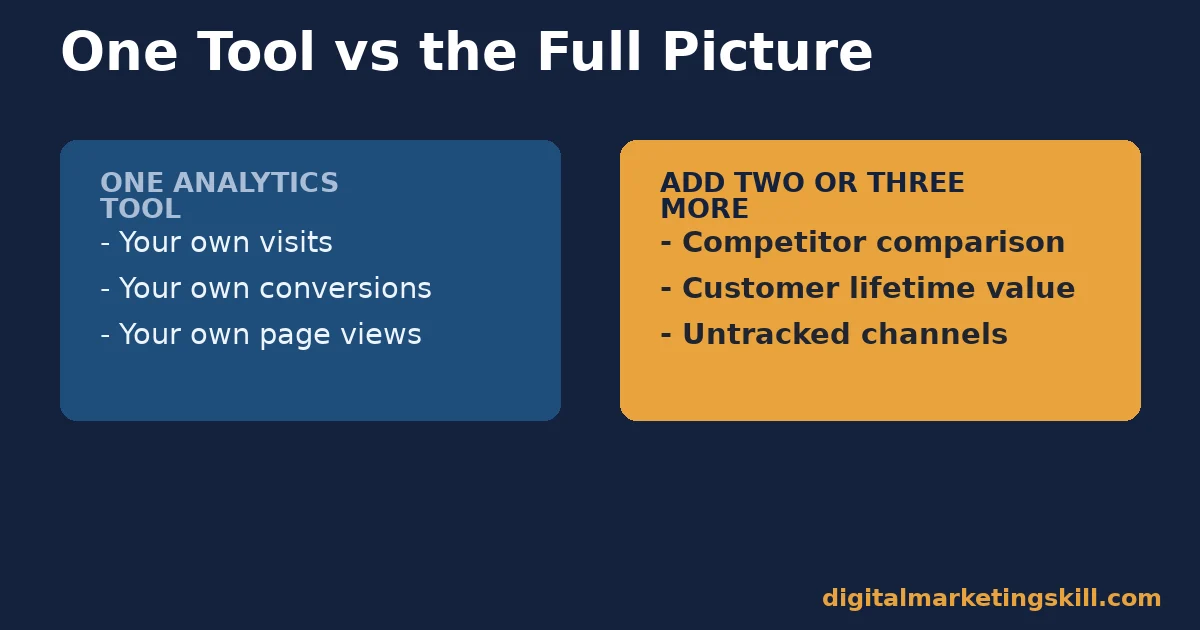
A standard analytics tool like Google Analytics measures what happens on your own site: visits, sources, pages, conversions. That is genuinely valuable. It is also structurally limited. It was never built to see a competitor’s traffic, your ranking against other sites, or the true long-term value of a customer who converted through a specific channel.
Our guide to reading Google Analytics reports with intent covers how to get the most from one tool before you add a second.
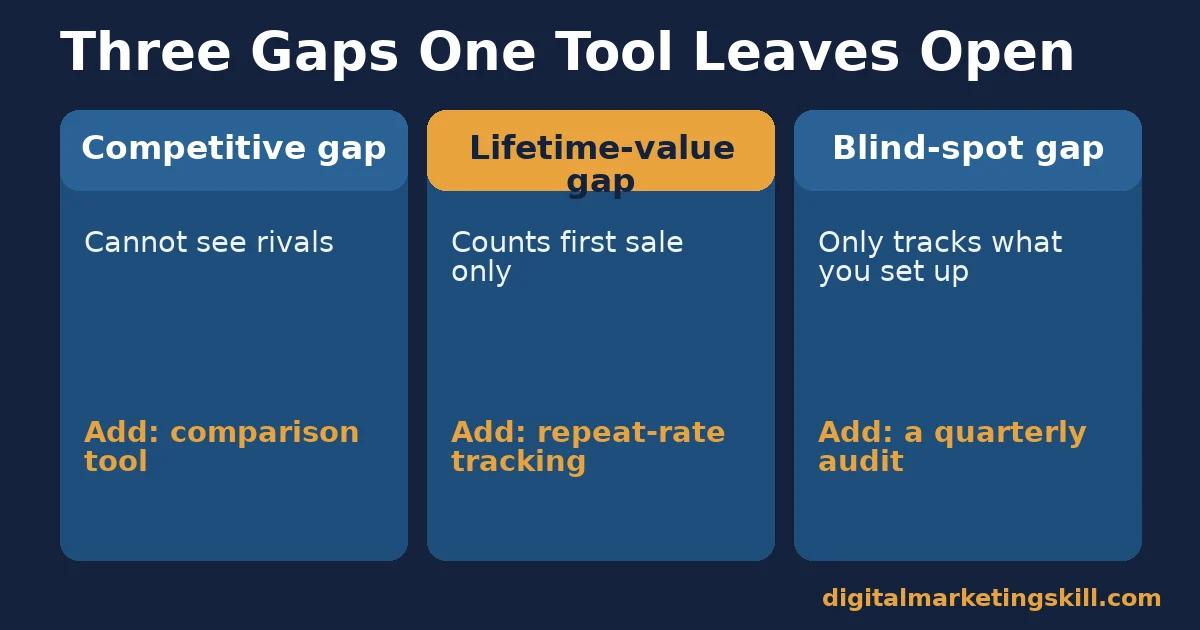
Three questions sit outside what a single site-level tool can answer. How do we compare with competitors on the same keywords and channels? Which channel brings in customers worth the most over time, not just the most conversions this month? And where are we quietly losing ground that our own numbers would never flag?
Why the Tool Landscape Keeps Growing
Marketing technology analyst Scott Brinker has tracked the martech landscape for years. His team’s most recent count found 14,106 marketing technology products, a 27.8% jump from the year before. That growth is not random noise. It reflects how many narrow questions a general analytics tool was never designed to answer.
No single product is likely to close every one of those gaps at once, however well funded it is. That is why a lean, deliberately chosen set of two or three marketing analytics tools beats a single dashboard. It also beats an unmanaged pile of a dozen logins nobody checks.
The size of the landscape is also a warning about choice overload. Faced with thousands of options, many teams default to whichever tool a vendor’s sales call was most persuasive about, rather than the one that actually closes a named gap. Starting from the three gaps in this guide, instead of a vendor list, keeps the decision grounded in your own numbers.
The Three Gaps a Single Analytics Tool Leaves Open
These three gaps show up in almost any business past its first few months, no matter which marketing analytics tools it already uses. Each is explained here, then paired with a fix in the next section.
The Competitive Gap: Built on What You Cannot See
Your own analytics tool has no visibility into a competitor’s traffic, rankings or ad spend. You can see an organic traffic dip, perhaps first in your traffic source reports. You cannot see whether a competitor just overtook you for the keyword that caused it. Without a second data source, a drop looks like a mystery instead of a specific, nameable event.
The Lifetime-Value Gap: Built on Counting the Wrong Thing
Standard analytics tools are built to count conversions, not long-term value. A channel with fewer conversions but far more repeat purchases can look weaker in a dashboard that stops at the first sale. Over a full year, it is often the stronger channel.
The Blind-Spot Gap: Built on What You Already Decided to Track
Every analytics tool only reports what it was configured to measure. A channel, campaign or page nobody set up tracking for stays invisible. From the dashboard’s point of view, an invisible channel is functionally the same as a channel that does not exist.
How to Close Each Gap in Your Marketing Analytics Tools
The sections below mirror the three gaps above. Add one marketing analytics tool or habit at a time, and confirm it changes a real decision before you add the next.
The Competitive Gap: Add One Comparison Tool
Pick one tool built specifically for competitive comparison, not a second general-purpose analytics platform. Use it for a narrow, recurring question. One example: which keywords do competitors rank for that you do not. Another: how your share of voice on one channel moved last quarter.
Review that comparison monthly, not daily. Competitive data moves slowly enough that daily checking mostly produces noise and anxiety rather than decisions.
The Lifetime-Value Gap: Track Repeat Behaviour, Not Just First Conversions
Add a simple repeat-purchase or repeat-engagement metric per channel, even a rough one. Track it alongside your normal conversion numbers. A channel with a lower conversion rate but a far higher repeat rate may be worth more than the channel your dashboard ranks first today.
Email is a common example of this gap in practice. A channel that looks modest by first-conversion count can still deliver a strong return once repeat purchases are counted. That gap is part of why Litmus’s survey found such a wide reported return range across marketers.
The Blind-Spot Gap: Audit What Is Not Being Tracked
Once a quarter, list every channel, campaign and page that sends you traffic or leads today, then check each one against your tracking setup. Anything untracked gets added before the next review, not left for “later.”
This audit catches channels that grew quietly, the ones a team started using without telling whoever owns analytics. These are often exactly the channels a competitive or lifetime-value review would have flagged first, had the data existed at all.
Keep the Stack Small Enough That Someone Actually Owns It
A stack with no clear owner tends to grow by accretion: one tool added for a campaign, another for a single report, none of them ever cancelled. Assign one person to own the full list of marketing analytics tools, even in a small team where that person wears several other hats too.
That owner’s job is narrow: know what each tool answers, flag overlap, and bring a cancellation recommendation to each renewal. Without a named owner, a growing tool list is nobody’s problem until the total cost becomes impossible to ignore.
Free Tools Can Close Two of the Three Gaps
Not every gap requires a paid subscription. A free search console tool shows which queries bring in traffic, which is a start on the competitive gap even without a dedicated comparison platform. A spreadsheet tracking repeat purchases per channel, updated monthly by hand, covers the lifetime-value gap for a small business that cannot yet justify a paid attribution tool.
The blind-spot gap is the one most likely to need something beyond a free tool, since catching an untracked channel usually means auditing tracking code across every page, a task that paid tools automate well. Start free wherever you can, and reserve paid marketing analytics tools for the specific gap a free option genuinely cannot close.
How to Measure Whether Extra Tools Are Worth Keeping
Marketing analytics tools are only worth their cost if they change a decision. Track these four signals before renewing any tool beyond your core analytics platform.
Four Questions to Ask About Every Tool
- Decisions changed. Count how many times in the last quarter this tool’s data directly changed a budget, channel or content decision. Zero is a strong signal to cancel it.
- Login frequency. Check how often anyone actually opens the tool. A tool nobody opens is not providing insight, no matter how good its dashboard looks in a sales demo.
- Overlap with existing tools. List what this tool reports that no other tool in your stack already reports. Heavy overlap is a sign of redundancy, not redundancy as backup.
- Cost per decision changed. Divide the tool’s annual cost by the number of decisions it genuinely changed. A high number here usually means the tool is underused, not that the tool is bad.
Our guide to picking the few digital marketing KPIs that actually matter covers the same discipline applied to metrics rather than tools.
How to Read These Four Signals Together
A tool that scores well on decisions changed and login frequency earns its place regardless of price. A tool with high overlap and low decisions changed is the first one to cut at renewal time, even if it once seemed essential.
Run this review before each tool’s renewal date, not on a fixed calendar. A tool bought in a hurry to solve one problem often outlives the problem it was bought for, quietly renewing every year without anyone checking whether it still earns its place.
A Five-Minute Audit Before You Buy Anything New
Before evaluating a new tool, spend five minutes on your existing marketing analytics tools. This short check often removes the need for a purchase entirely.
- List every login your team pays for today. Include free tools too, since they still cost someone’s time to check.
- Mark the ones nobody has opened this month. A tool with no recent logins is not meeting a real need, whatever it promised at purchase.
- Write the one decision each remaining tool is meant to support. If two tools support the same decision, one of them is redundant.
Only after this audit should you consider adding anything new. Most teams find at least one existing tool that already answers the question they were about to pay for again.
The One Decision Rule: Add a Tool Only for a Named Question
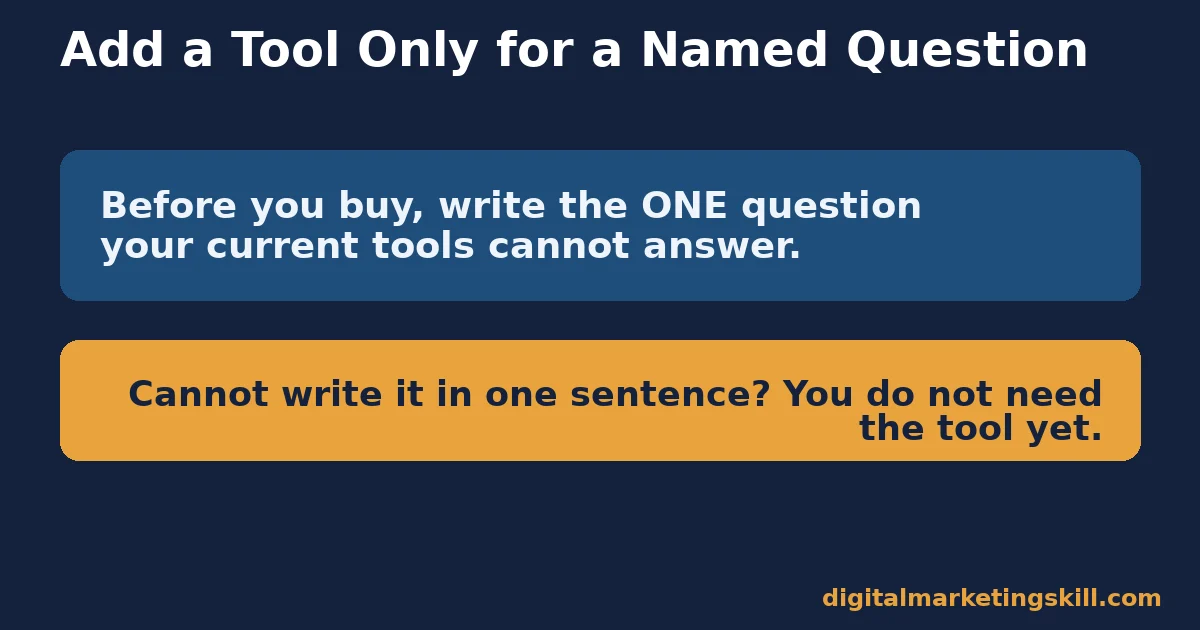
If you take one decision rule from this guide, make it this one. Before adding any marketing analytics tool, write down the single, specific question it will answer that your current stack cannot. If you cannot write that question in one sentence, you do not need the tool yet.
Here is an illustrative example, with invented numbers. A small agency adds a competitive-tracking tool to answer one question: which of three target keywords do we trail furthest behind on. Three months later, the tool answered that question clearly.
The agency built content to close two of the three gaps, and organic traffic from those terms rose. It now checks that same narrow question monthly and has not expanded the tool’s use beyond it.
The discipline matters more than the tool. A tool bought to answer everything usually ends up answering nothing well, and gets abandoned within a year once the novelty fades.
A Real Case: What “Peak Martech” Looks Like in Practice
Scott Brinker, the analyst behind the annual martech landscape count, has described the industry as having reached what he calls “peak martech.” The rate of new product growth has flattened after roughly fifteen years of rapid expansion, even as the total number of tools keeps climbing.
The practical lesson for a single business is not about the industry total. No obvious “right” stack has emerged for any given company, despite the explosion of available tools. Brinker’s own commentary repeatedly points to selection discipline, not tool count, as the real difference between teams that use their data well and teams that just collect dashboards.
The limit worth stating plainly: Brinker’s landscape count tracks how many products exist, not how many any one company should use, and it says nothing about which specific tools suit your business. Treat it as context for why no single tool has “won,” not as a buying guide.
Frequently Asked Questions About Marketing Analytics Tools
Is Google Analytics enough on its own?
For understanding your own site’s traffic and conversions, often yes. For comparing yourself against competitors, judging true customer lifetime value, or catching untracked channels, no single site-level tool is built to answer those questions alone.
How many marketing analytics tools does a small business actually need?
Usually two or three beyond a core analytics platform: one for competitive comparison, one for the channel that matters most to revenue, and sometimes one for a specific blind spot like email or social. More than that is rarely used in practice.
How do I know if a paid analytics tool is worth renewing?
Count how many real decisions it changed over the last quarter and how often anyone actually logs in. A tool with little use and heavy overlap with another tool is the first one to cut.
What is the biggest mistake businesses make with marketing analytics tools?
Buying a new tool to solve a single problem, then never reviewing whether it is still needed once that problem is solved. Renewals should be reviewed against current decisions, not approved automatically.
Do I need a separate tool for competitor analysis?
Not yet, if competitive comparison influences none of your decisions today. Once you find yourself guessing why a competitor is outranking or outspending you, a dedicated comparison tool usually pays for itself quickly.
Can too many analytics tools actually hurt decision-making?
Yes. Conflicting numbers across overlapping tools slow decisions and erode trust in data generally. A small, deliberately chosen set of tools that agree with each other beats a large collection that occasionally contradicts itself.
Who should own the marketing analytics tools a team uses?
One named person, even on a small team where that is not their only responsibility. Without an owner, tools accumulate by accretion and nobody reviews whether each one still earns its place.
Start With the Question, Not the Tool
Marketing analytics tools earn their place by answering a specific question your stack cannot answer today. Write down that one question, check whether an existing tool already covers it, and only then evaluate a new tool against that single, named gap.
For structured practice building and reading a lean analytics stack like this, Digital Marketing Skill Institute teaches it hands-on. Its Master Diploma in Digital & AI Marketing offers four AI-powered tracks totalling ten courses, including AI-Powered Google Specialist, which covers Google Analytics and the comparison tools this guide describes.
The diploma has a Full Stack option covering all four tracks, unlimited 1-on-1 coaching, a U.S. Project Internship with a verified U.S. Work Reference Letter, and dual US and UK accreditation, recognised in more than 100 countries.
The programme is fully online, so you can build these skills from anywhere in your country. Browse more guides on the Digital Marketing Skill Institute blog, read real outcomes on the reviews page, and when you are ready, apply for the Master Diploma or start from the Digital Marketing Skill Institute homepage.
Every figure in this guide was checked against its original source before publication. Figures marked as illustrative are invented examples, not real results.
![9 Amazing Digital Marketing Skills to Make Money Online [With Proof]](https://digitalmarketingskill.com/wp-content/uploads/2019/07/9-Amazing-Digital-Marketing-Skills-to-Make-Money-Online-With-Proof-17.png)






