

Google Analytics reports only help you if you know which one answers your question. Most people open the home screen. They see a wall of numbers. They give up. This guide maps the main report groups to real business questions, so you stop guessing and start reading with intent.
Key Takeaways
- Google Analytics is nearly universal. W3Techs found Google Analytics is used by 47.3% of all websites. That means the skill of reading its reports transfers across almost any business you work with.
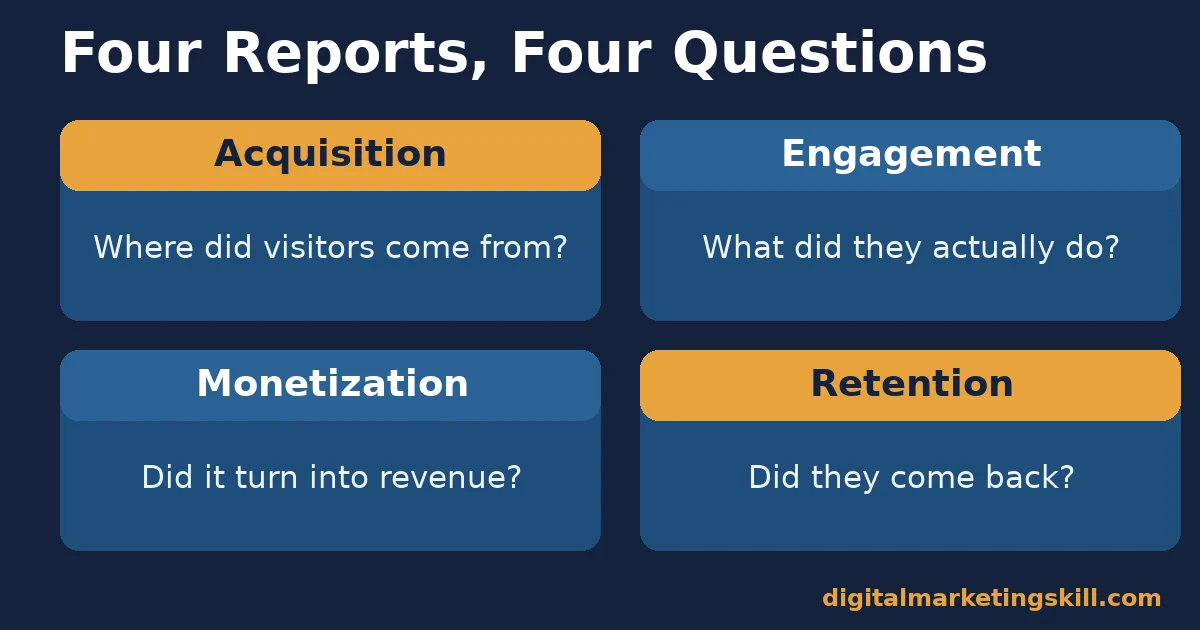
- Reports are grouped by business question, not by menu order. The Life Cycle collection splits into Acquisition, Engagement, Monetization and Retention, each answering a different question about your visitors.
- Engagement is a defined metric, not a feeling. Google’s own documentation defines an engaged session as one lasting over 10 seconds, containing a key event, or including two or more pageviews.
- Conversions have a new name. Google renamed “conversions” to “key events” to reduce confusion with Google Ads, though the underlying data collection did not change.
- Most reports answer one of three questions. Where did visitors come from, what did they do, and did they come back? Every report group maps to one of those three.
In this guide
- What Most Google Analytics Advice Misses
- Why Reading Reports Correctly Matters More Than Collecting More Data
- Why the Report Structure Changed, and What Stayed the Same
- The Four Report Groups and the Question Each One Answers
- How to Read Each Report Group Without Getting Lost
- Before You Read Reports, Confirm Tracking Is Actually Set Up Right
- Common Mistakes When Reading Google Analytics Reports
- A Simple Weekly Habit for Reading Google Analytics Reports
- The Most Useful Rule: Match the Report to the Question, Not the Other Way Round
- A Real Case: Why “Conversions” Became “Key Events”
- Frequently Asked Questions About Google Analytics Reports
- Start With One Real Question This Week
What Most Google Analytics Advice Misses
Most tutorials walk through every menu item in order. That approach teaches you where buttons live. It does not teach you which report to open when you actually have a question, such as whether a campaign worked or whether visitors are coming back.
This guide works the other way round. It starts from common business questions and points to the Google Analytics reports that answer each one. Engagement definitions get covered too, since a report is only useful once you know what counts as an engaged visit.
One ground rule. Google Analytics reports change their interface and report names periodically, most recently when conversions became key events. The underlying report groups described here, Acquisition, Engagement, Monetization and Retention, have stayed stable as the organising structure, so this guide anchors on those.
Why Reading Reports Correctly Matters More Than Collecting More Data
Google Analytics reports are only valuable if someone reads them with a specific question in mind. According to W3Techs, Google Analytics is used on 47.3% of all websites. That scale matters. The skill of reading reports correctly, not just installing the tracking code, is what separates useful analytics from a dashboard nobody opens.
Most of the value sits in four report groups, under what Google calls the Life Cycle collection. Each one answers a different stage of the visitor relationship. One covers how they found you. Another covers what they did. The rest cover whether they paid and whether they returned.
What Counts as an “Engaged” Visit
Before any report makes sense, you need to know what Google Analytics counts as engagement. According to Google’s own documentation, a session is engaged if it lasts longer than 10 seconds, includes a key event, or has two or more pageviews or screenviews. Engagement rate is simply the share of sessions that meet that bar.
This definition matters because every engagement-based report inherits it. A low engagement rate does not always mean bad content. It can also mean visitors found their answer in under 10 seconds, which is a different problem with a different fix.
Why the Report Structure Changed, and What Stayed the Same
If you learned analytics on the older Universal Analytics interface, the report names will look unfamiliar. Universal Analytics organised data around sessions and pageviews first. Google Analytics 4 organises it around events and the Life Cycle collection instead, because modern visitors move between apps and web in ways the old session model struggled to capture.
The practical effect is simple. A goal funnel report or a shopping-cart-abandonment report built for the old interface will not exist under the same name today. The business question behind it, such as where visitors drop off before checkout, still has an answer. It just lives inside the Monetization and Engagement report groups now, described in the sections below.
Key events, the metric formerly called conversions, sit at the centre of that shift. Instead of configuring a rigid funnel, you mark any event, such as a form submission or a purchase, as a key event, and every relevant report then tracks it automatically.
The Four Report Groups and the Question Each One Answers
Each group below maps to one practical question. Learn the question first, and the right report becomes obvious.
Acquisition: Where Did Visitors Come From?
Acquisition reports split into two views. User acquisition looks at where first-time visitors originally came from. Traffic acquisition covers every session, new and returning. Use user acquisition to judge which channel brings in new audiences, and traffic acquisition to see which channel is driving sessions right now.
Engagement: What Did Visitors Actually Do?
Engagement reports cover events, key events and the pages or screens people viewed. This is where you confirm whether visitors did the things that matter to your business, such as watching a video, starting a signup, or reading past the first screen of an article.
Monetization: Did Any of This Turn Into Revenue?
Monetization reports track purchases, revenue and, for ecommerce sites, product performance. This group exists to connect traffic and engagement data back to money, which is the question every other report eventually has to answer for a commercial site.
Retention: Did Visitors Come Back?
Retention reports show how many users return after their first visit, and for how long they keep coming back. A site can have strong acquisition and engagement numbers and still fail here, which usually signals a one-time-use product or an unmet ongoing need.
How to Read Each Report Group Without Getting Lost
The sections below mirror the four groups above. Each one gives a starting habit, not a full tutorial, since the goal is reading the reports with intent rather than memorising every field.
Acquisition: Check Channel Mix Before Anything Else
Open traffic acquisition first and sort by sessions. If one channel dominates, your business is exposed to that channel’s risk, whether that is a search ranking or an ad platform’s policy. A healthy mix is not mandatory, but an accidental one is worth knowing about.
Then switch to user acquisition and compare it with traffic acquisition. A channel that drives many sessions but few new users is mostly recycling existing visitors, which is a different, often cheaper, kind of success.
Engagement: Pair the Rate With the Page
Never read engagement rate alone. Pair it with the specific page or event it describes. A 40% engagement rate on a contact page might be fine, since visitors often glance and leave once they find a phone number. The same rate on a core article is a real problem.
Check key events next. If a key event never fires in the Events report, your tracking setup is broken, not your content. Fix tracking before you draw any other conclusion from the report.
A Quick Engagement Check: Scroll Depth
One engagement signal worth checking directly is scroll depth. Google’s enhanced measurement documentation explains that a scroll event fires the first time a visitor reaches 90% of a page’s vertical height. If that event almost never fires on a long article, most visitors are leaving well before the end, regardless of what the overall engagement rate shows.
Monetization: Connect It Back to the Channel That Paid For It
Do not read monetization reports in isolation from acquisition. Cross-reference revenue against the channel that brought the buyer in, so you know which spend is actually paying for itself, not just which channel brings the most traffic.
Watch product-level detail if you run ecommerce. A single product can quietly carry most of your revenue, which changes how much attention your merchandising and stock planning should give it.
Retention: Judge It Against Your Own Product, Not a Universal Benchmark
There is no single good retention number, because it depends entirely on what your site or app is for. A one-time reference tool is not supposed to see daily return visits. A subscription product is.
Instead of chasing a benchmark, compare retention before and after a real change, such as a new onboarding flow or a content update. That comparison tells you whether the change worked, which is more useful than comparing yourself to an unrelated business. Give any change a few weeks to settle before judging it, since early numbers often swing more than the underlying trend.
Before You Read Reports, Confirm Tracking Is Actually Set Up Right
No report, however well you read it, fixes broken tracking underneath it. Before trusting any number, open the key events configuration and confirm the handful of actions that matter to your business, such as a purchase, a signup or a quote request, are actually marked.
Then send yourself one test action and watch it appear in the real-time view. This two-minute check catches the most common reporting failure: a business reading weeks of data built on a key event that was never firing in the first place.
Once tracking is confirmed, revisit it after any website redesign or platform migration. A new page template or a changed button can silently break a key event without any error message, so the check belongs on a recurring schedule, not just at launch.
Common Mistakes When Reading Google Analytics Reports
Most reporting mistakes are not about missing data. They are about reading the right report the wrong way. Check your own habits against this list.
- Treating engagement rate as a content quality score. It also reflects how fast visitors found what they needed, which is not always a bad outcome.
- Reading acquisition without checking tracking first. A channel showing zero sessions is often a tagging problem, not a traffic problem.
- Ignoring the gap between user and traffic acquisition. Confusing new-visitor data with all-visitor data leads to the wrong channel getting credit or blame.
- Comparing retention across unrelated businesses. A benchmark from a different industry or product type tells you almost nothing useful.
- Checking Google Analytics reports once and never again. A single snapshot cannot show a trend. Build a short weekly habit instead.
- Assuming the old report names still apply. A goal funnel or a bounce-rate-only view from the older interface now lives under a different name and a different logic, inside Engagement or Monetization.
- Acting on one metric in isolation. A single number rarely tells the full story on its own, so pair it with at least one other report before changing a budget or a page.
A Simple Weekly Habit for Reading Google Analytics Reports
You do not need a dashboard overhaul to get value from this. A short, repeatable weekly check beats an occasional deep dive, because patterns only show up over time.
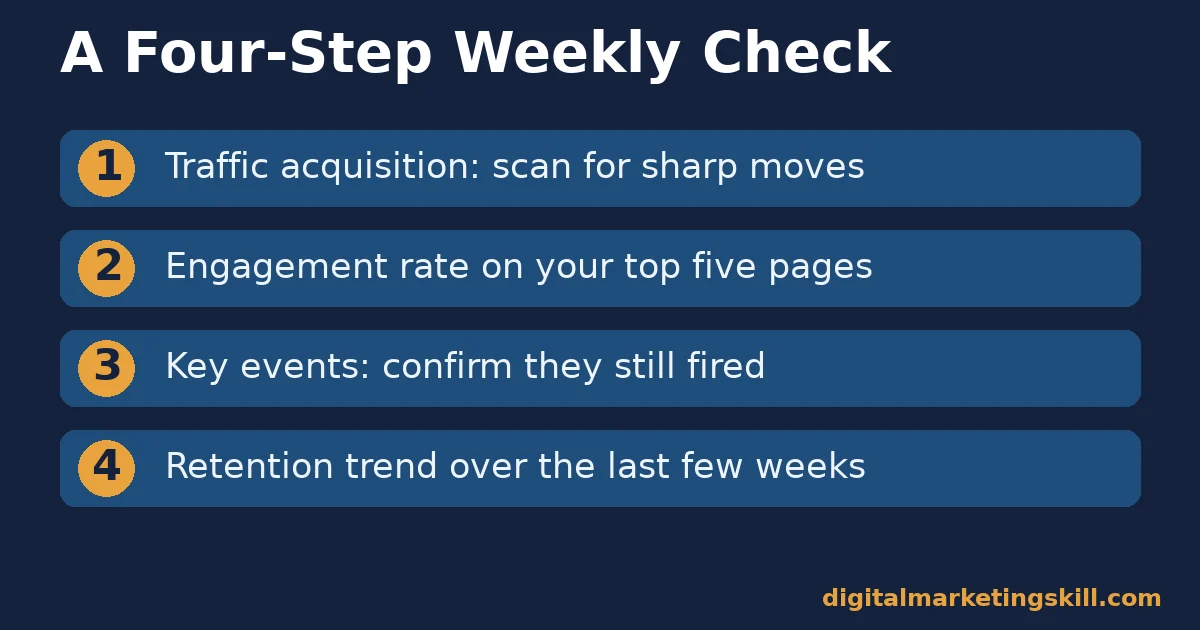
Four Checks, In This Order
- Traffic acquisition. Scan for any channel that moved sharply, up or down, from the week before.
- Engagement rate on your top five pages. Flag any page that dropped noticeably, then check whether content or tracking changed.
- Key events. Confirm your main key events still fired this week. A silent key event is a tracking break, not a real drop in activity.
- Retention trend. Glance at whether returning visitors are trending up, flat or down over the last few weeks, not just this one.
Reading the Four Checks Together
If traffic and engagement both look healthy but retention is falling, the product or content is not giving visitors a reason to return, even though it is doing its first-visit job well. If engagement is falling but traffic is steady, something on the page changed, intentionally or not.
Treat a single week’s dip as a flag to watch, not a crisis. Treat the same dip repeated three weeks running as a real signal worth investigating properly. A short note of what changed each week, even one line, makes this pattern far easier to spot later than relying on memory alone.
The Most Useful Rule: Match the Report to the Question, Not the Other Way Round
If you take one decision rule from this guide, make it this. Write down your actual question before opening any report. Then pick the report group that answers that specific question, instead of opening the home screen and reacting to whatever number is biggest.
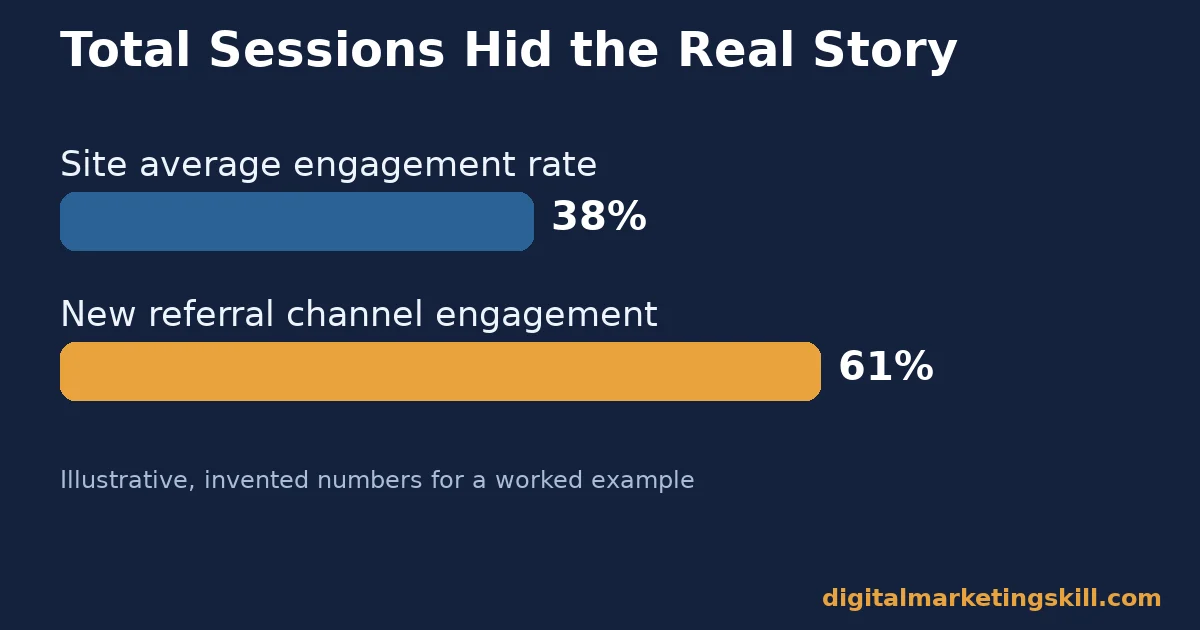
Here is an illustrative example, with invented numbers. A small services business wants to know if a new referral partnership is working. The owner initially checks the overview report and sees total sessions are flat. Reading that way, the partnership looks like it failed. Checking user acquisition instead, referral traffic from the partner’s site shows 85 new users that month, all new to the business, with an engagement rate of 61%, well above the site average of 38%. Total sessions were flat because another channel dropped at the same time. The partnership was actually working. Only the right report group showed that.
A Real Case: Why “Conversions” Became “Key Events”
Google’s decision to rename conversions to key events inside Google Analytics reports is a useful case study in reading documentation carefully rather than relying on memory. The change took effect because conversions in Google Ads are defined and counted differently from conversions inside Analytics, which created confusing mismatches between the two platforms’ numbers.
The underlying data collection did not change, as confirmed in Google’s own rename documentation. Any event already marked as a conversion automatically became a key event. The lesson for anyone reading Google Analytics reports is straightforward: terminology shifts over time, but the report groups and definitions described in this guide, acquisition, engagement, monetization and retention, have remained the stable backbone underneath those naming changes.
Treat every walkthrough, including this one, as a snapshot of current naming. Verify against Google’s own current documentation before making a significant reporting decision, since interface details shift more often than the underlying structure. Bookmark the official help pages rather than a single tutorial, so you always land on the current version when something changes again.
Frequently Asked Questions About Google Analytics Reports
Which Google Analytics report should I check first?
Start with whichever question you actually have. Traffic questions belong in acquisition. Behaviour questions belong in engagement. Revenue questions belong in monetization, and loyalty questions belong in retention.
What is a good engagement rate in Google Analytics reports?
There is no universal good number, because it depends on the page’s purpose. Compare a page against its own past performance and against similar pages on your own site, rather than against an unrelated benchmark.
Why did my conversions disappear from Google Analytics reports?
They likely did not disappear. Google renamed conversions to key events, so look for that term instead. The underlying tracking and data remained the same through the rename.
How often should I check Google Analytics reports?
A short weekly check catches real trends without becoming a time sink. Reserve a deeper monthly review for bigger decisions, such as budget shifts between channels.
What is the difference between user acquisition and traffic acquisition?
User acquisition tracks where first-time visitors originally came from. Traffic acquisition covers all sessions, including returning visitors. Use both together to avoid crediting a channel with visitors it did not actually bring in new.
Can Google Analytics reports show me if a referral partnership is working?
Yes, through the user acquisition report, filtered to the referral channel. Check both the volume of new users and their engagement rate, not just session count, since a quiet but highly engaged referral source can outperform a louder one.
Do small businesses need to read every report group?
No. Start with acquisition and engagement, since most early decisions depend on those two. Add monetization once you sell directly through the site, and retention once you have enough repeat-visit data to act on.
What happened to the old Universal Analytics reports?
Universal Analytics stopped processing new data. Its report structure, built around sessions and goal funnels, was replaced by GA4’s event-based Life Cycle reports. The underlying business questions did not change. Only the report names and the way you configure tracking did.
How do I check if my Google Analytics tracking is actually working?
Open the real-time report, then trigger the action yourself, such as submitting a form or completing a test purchase. If the event and the matching key event both show up within a minute or two, tracking is working. If nothing appears, fix the setup before trusting any other report.
Start With One Real Question This Week
Google Analytics reports are only as useful as the question driving you into them. Pick one real question about your traffic, content, revenue or returning visitors this week, open the matching report group, and read it with that single question in mind before you look at anything else. Write the answer down, however small, so next week’s check builds on this one instead of starting over.
If you want to build this skill properly, alongside the wider analytics and campaign tracking work it supports, Digital Marketing Skill Institute teaches it hands-on. The Master Diploma in Digital & AI Marketing covers 10 courses across four AI-powered tracks, including the AI-powered Google Specialist track. It comes with unlimited 1-on-1 coaching and mentoring and real project-based work experience with a US partner company from day one. The diploma is dual US and UK accredited and recognised in more than 100 countries.
The program is 100% online, so you can study and apply this anywhere in your country. Related guides, including Google Analytics for beginners, tracking campaigns in Google Analytics and how to increase your website conversion rate, are on the Digital Marketing Skill Institute blog. When you are ready, apply for the Master Diploma or start from the Digital Marketing Skill Institute homepage.
Every figure in this guide was checked against its original source before publication. Figures marked as illustrative are invented examples, not real results.
![9 Amazing Digital Marketing Skills to Make Money Online [With Proof]](https://digitalmarketingskill.com/wp-content/uploads/2019/07/9-Amazing-Digital-Marketing-Skills-to-Make-Money-Online-With-Proof-17.png)






