
Website optimisation means finding the exact point where a visitor decides not to buy, then fixing that point. Most sites lose visitors to six fixable causes. A fuzzy value proposition, a weak call to action, a slow or cluttered page, the wrong audience, thin content, and no quick way to see the product in action. Fix the one that applies to your site and the same traffic converts more often, with no extra ad spend.
Key Takeaways
- The average online cart is abandoned 70.19% of the time, across 44+ large-sample studies tracked by the Baymard Institute’s checkout research.
- Baymard’s audit of 344 top-grossing e-commerce sites found 32 separate checkout usability issues per site on average. Fixing them lifts completed orders by roughly 35%.
- Unexpected costs are the single biggest abandonment trigger. Baymard’s abandonment data found 40% of shoppers quit for that reason, ahead of slow delivery (20%) and payment distrust (19%).
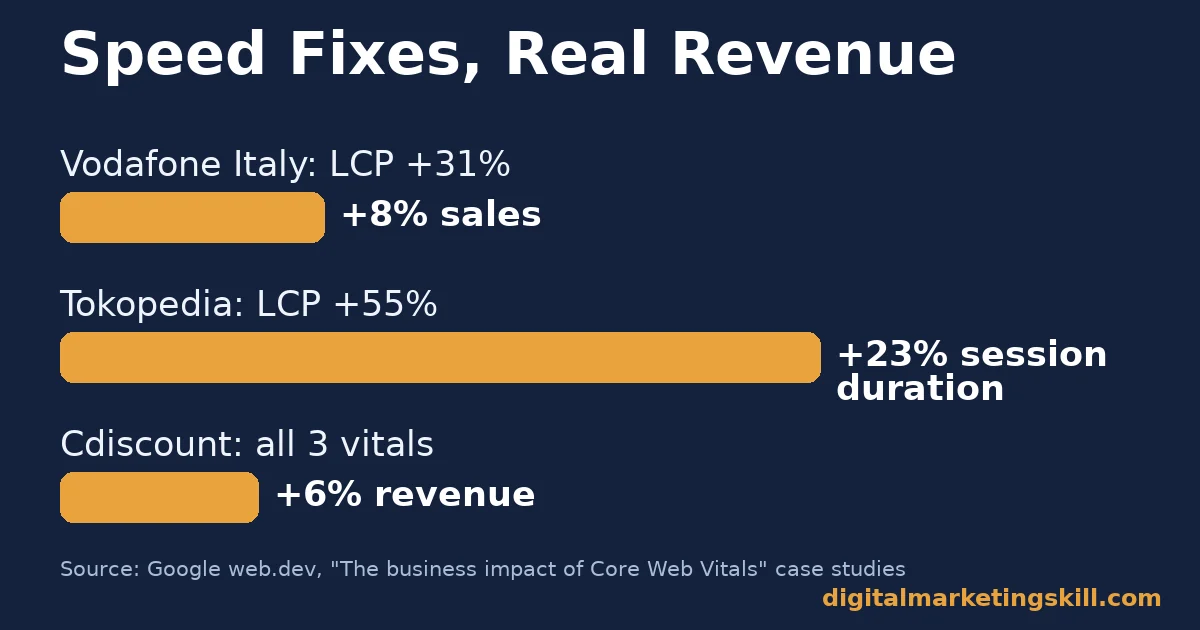
- Google’s Core Web Vitals case studies show real gains from speed fixes alone. Tokopedia gained 23% more session duration, Vodafone Italy gained 8% more sales, and Cdiscount gained 6% more revenue, all from existing traffic.
- Mobile bounce probability rises 32% when load time slips from one second to three. A slow page can sink website optimisation before a visitor even reads your value proposition.
In this guide
- Most Advice Lists Symptoms, Not the Six Root Causes
- The Mechanism: Every Visit Is a Chain of Small Decisions
- What Differs By Cause: Six Reasons Visitors Leave Without Buying
- No Clear Value Proposition: Visitors Can’t Answer “What Is This?”
- No Clear Call To Action: Visitors Don’t Know What To Do Next
- Low Visual and Technical Quality: Slow or Cluttered Pages Lose Visitors First
- Targeting the Wrong Audience: The Page Answers a Question Nobody Asked
- Thin or Unconvincing Content: Claims Without Proof Read as Filler
- No Way to See the Product or Service in Action
- Lead With the Fix That Matches Your Signature
- Value Proposition: Lead With One Sentence a Stranger Can Repeat Back
- Call To Action: Lead With One Instruction Per Page, Stated as a Verb
- Visual and Technical Quality: Lead With the Core Web Vitals That Move Revenue
- Audience Match: Lead With Proof and Language That Mirror the Traffic Source
- Content: Lead With Named Evidence Instead of Unsupported Claims
- Show It Working: Lead With a Short, Real Demonstration
- Measuring Website Optimisation: The Four Numbers That Matter
- The One Decision Rule: Fix the Biggest Drop-Off First, Not the Easiest Fix
- Common Mistakes That Undo Website Optimisation Work
- What This Looks Like in Practice
- Frequently Asked Questions About Website Optimisation
- Next Step: Diagnose One Page Before You Change Anything
Most Advice Lists Symptoms, Not the Six Root Causes
Search “why is my website not converting.” Most results repeat the same checklist. Add trust badges. Shorten the form. Change the button colour. Those are tweaks, not diagnosis. The real question is which of six root causes is costing you the sale, because each cause needs a different fix.
This guide treats website optimisation as a diagnosis, not a checklist. Name the cause, show the evidence behind it, apply the matching fix, then measure the result. Every figure below comes from named, checkable research. Where a number is US-only or self-reported, that limit is stated plainly, so you can weigh it correctly for your own market.
The Mechanism: Every Visit Is a Chain of Small Decisions
A visitor does not decide once to buy. They decide dozens of times, in sequence. Is this page relevant? Does this company look credible? Is the price fair? Does checkout feel safe? Will delivery arrive on time? Website optimisation works by removing the decision points most likely to break that chain, because a visitor who stalls rarely comes back to finish later.
That is why fixing checkout usability alone can lift completed orders by about 35%, according to Baymard’s audit. The traffic and the buying intent were already there. Friction at one single step was the only thing missing. The same logic applies above the fold, inside your content, and in the time your page takes to load.
What Differs By Cause: Six Reasons Visitors Leave Without Buying
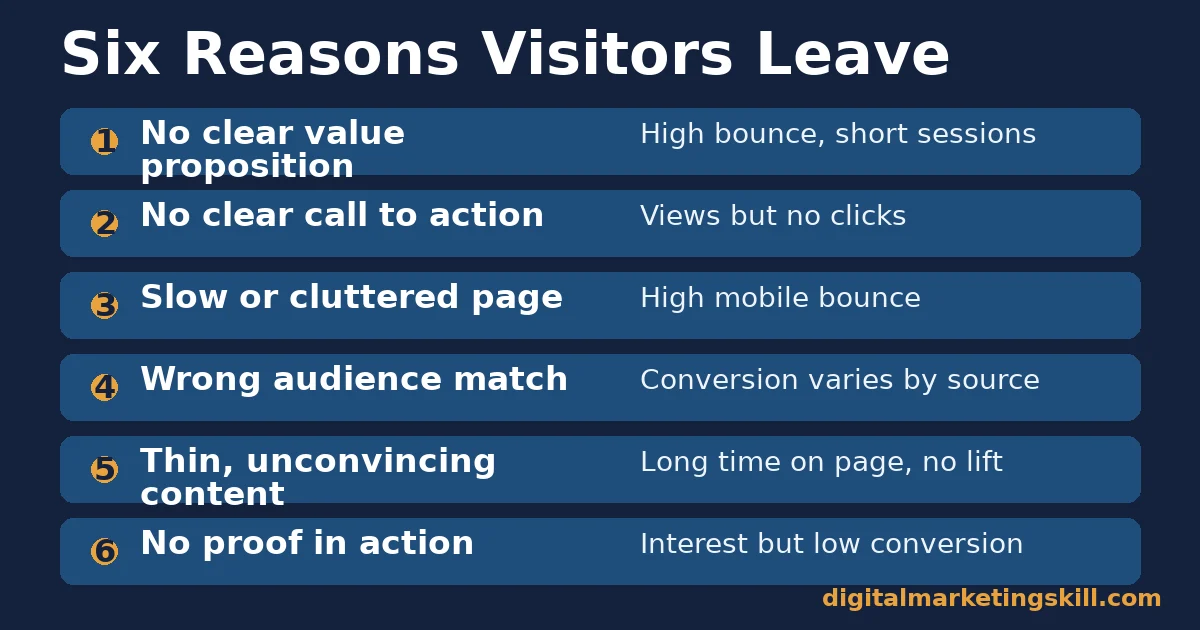
These six causes rarely act alone. But each leaves a distinct signature in your analytics, and each needs a distinct fix. Diagnose which one applies before you change anything.
No Clear Value Proposition: Visitors Can’t Answer “What Is This?”
A value proposition is the one sentence that tells a visitor what you do, for whom, and why it beats the alternative. Nielsen Norman Group’s homepage research describes users “staring right at the homepage, unable to satisfactorily answer the question ‘what is the purpose of this site?'” When that happens, every other fix is wasted. The visitor never gets far enough to see it.
Signature in analytics: a high bounce rate on the homepage or landing page, short sessions, and low scroll depth. The page gets traffic, but almost nobody scrolls past the first screen.
No Clear Call To Action: Visitors Don’t Know What To Do Next
A call to action is the single next step you want a visitor to take, stated as an instruction, not implied. Baymard’s research found 18% of shoppers who quit a purchase did so because the site forced an unexpected step, usually an account they were never asked to create in advance. A missing or vague call to action causes the same stall earlier, when a visitor is interested but not told what to do next.
Signature in analytics: visitors land on a page and leave without clicking anything, and a form or product page gets views but almost no starts.
Low Visual and Technical Quality: Slow or Cluttered Pages Lose Visitors First
Visual quality is not decoration. It is a trust signal and a speed signal combined. Google’s Core Web Vitals case studies record real businesses recovering revenue from speed and stability fixes alone. Vodafone Italy improved its Largest Contentful Paint, the time the main content takes to render, by 31%. Sales rose 8% from the same traffic, with no other change. Redbus cut its load and response delays roughly in half. Its mobile conversion rate then rose 80 to 100%. Separate research cited by Nielsen Norman Group found mobile bounce probability climbs 32% as load time goes from one second to three.
Signature in analytics: high bounce specifically on mobile, a wide gap between desktop and mobile conversion rate, and weak Core Web Vitals scores in Search Console.
Targeting the Wrong Audience: The Page Answers a Question Nobody Asked
Traffic quality matters more than traffic volume. One page cannot serve two different buyers equally well. A page built for an enterprise manager comparing vendors will under-convert a student comparing prices, even on the exact same URL. The images, the proof points and the language all need to match the intent that brought the visitor there in the first place.
Signature in analytics: conversion rate swings sharply by traffic source or keyword for the same page, and on-site search shows visitors looking for something the page never answers.
Thin or Unconvincing Content: Claims Without Proof Read as Filler
Copy that asserts quality without evidence reads as filler, and visitors skim right past it. A specific number, a named source, or a real result gives a skimming reader something concrete to anchor on instead. This cause is easy to confuse with “not enough content,” when the real problem is content that makes claims it cannot back up.
Signature in analytics: long time on page with no matching lift in conversion. Visitors are reading, but nothing is persuading them.
No Way to See the Product or Service in Action
Visitors convert faster when they can picture the outcome before buying. A short demo, a worked example, or a simple walkthrough does this better than descriptive text alone. It does not need production value. It needs to show the thing working, once, clearly.
Signature in analytics: strong interest in clicks and time on page, but a lower conversion rate than similar pages that include a demonstration.
Lead With the Fix That Matches Your Signature
Match the fix to the cause you diagnosed above. Applying all six fixes at once wastes effort on causes that were never the real problem on your site.
Value Proposition: Lead With One Sentence a Stranger Can Repeat Back
Put the value proposition above the fold, in plain language, before any slogan or stock photo. State who it serves, what changes for them, and why you beat the alternative. Test it on someone unfamiliar with the business. Read them only that sentence and ask them to repeat what the site does. If they cannot, rewrite it. A clear value proposition pairs naturally with a focused landing page design built around one offer, not several competing messages.
Call To Action: Lead With One Instruction Per Page, Stated as a Verb
Give every page exactly one primary action, written as a verb: “Start your free trial,” “Book a call.” Repeat it at the top and bottom of long pages, and remove any competing action nearby. If a step like account creation is unavoidable, say so before the visitor reaches it. Baymard’s data shows the surprise causes the drop, not the step itself. These lead conversion strategies cover the same pattern in more depth.
Visual and Technical Quality: Lead With the Core Web Vitals That Move Revenue
Measure Largest Contentful Paint, Cumulative Layout Shift and interaction responsiveness in the Google Search Console Core Web Vitals report. Fix the worst score first. The case studies above show that fixing even one of the three produces a measurable revenue change within weeks. Compress images, defer scripts that are not critical, and remove layout shifts caused by late-loading ads or fonts. The same diagnostic approach applies to website page speed fixes generally, not just to Core Web Vitals specifically. Mobile conversion rate often lags desktop on the exact same page for this reason alone.
Audience Match: Lead With Proof and Language That Mirror the Traffic Source
Build a separate landing page for each distinct audience segment, instead of sending every source to one generic page. Match the headline, the proof points and the images to the intent that brought the visitor there. Check your on-site search queries monthly to catch new mismatches early, before they cost you meaningful traffic. If one traffic source consistently converts worse than the others on an identical page, that gap is the signal, not a reason to assume the whole page is weak.
Content: Lead With Named Evidence Instead of Unsupported Claims
Replace generic claims with a specific number, a named source, or a real result, even a small one. One verifiable sentence with a source outperforms a full paragraph of description. It gives a skimming reader a concrete reason to trust the next claim too, and the one after that.
Show It Working: Lead With a Short, Real Demonstration
Add one short walkthrough, screen recording, or worked example to each key page. Show the actual product or service, not a description of it. Keep the demonstration specific to that page’s exact use case. A generic overview converts worse than one matched to the visitor’s exact question.
Measuring Website Optimisation: The Four Numbers That Matter
Track these four numbers alongside whatever metrics you already use. Each one isolates a different link in the decision chain described above.
- Bounce rate by landing page: the share of visits that leave without further interaction. A rising bounce rate on one page points at a value-proposition or speed problem on that page, not the whole site.
- Conversion rate by traffic source: completed goals divided by sessions, split by where the visitor came from. A wide spread between sources on the same page points at an audience-match problem.
- Core Web Vitals pass rate: the share of page loads that meet Google’s thresholds for speed, visual stability and responsiveness, visible in Search Console. A falling pass rate predicts a conversion drop before revenue fully shows it.
- Cart or form abandonment rate: the share of visitors who start a checkout or form and never finish it. Compare this against Baymard’s 70.19% benchmark with caution, since that figure includes browsers with no purchase intent. Track your own trend over time instead of chasing the exact benchmark number.
The One Decision Rule: Fix the Biggest Drop-Off First, Not the Easiest Fix
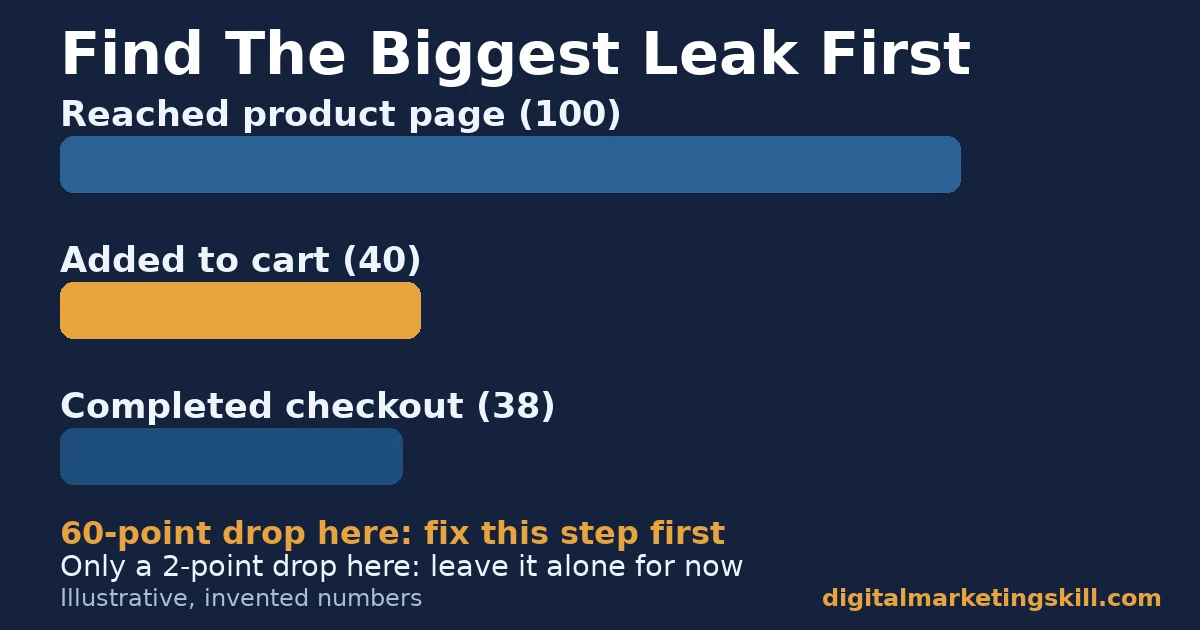
When time for website optimisation is limited, the instinct is to start with the easiest change: a button colour, a headline tweak. The higher-leverage rule is different. Find the single step in your funnel with the largest percentage drop-off between two stages, and fix only that step before moving on.
Illustrative, invented numbers: say a funnel shows 100 visitors reaching a product page, 40 adding to cart, and 38 completing checkout. The biggest leak sits between “reached the page” and “added to cart,” a loss of 60 points. The leak between cart and checkout is only 2 points. Spending a week perfecting the checkout form here would fix a problem that barely exists. The real leak, likely a weak value proposition or call to action on the product page, stays unfixed.
Common Mistakes That Undo Website Optimisation Work
Three mistakes show up again and again once a team starts fixing website optimisation issues, and each one quietly cancels out the gains above.
- Changing more than one variable at once. If you rewrite the headline, swap the hero image and compress every photo in the same release, you cannot tell which change moved the conversion rate. Ship one fix, measure for at least a full week of normal traffic, then move to the next.
- Chasing the Baymard benchmark instead of your own trend. A 70.19% abandonment rate is a global average across many industries and basket sizes. A subscription box site and a business software trial will never land on the same number. Compare this month against last month on your own site, not against someone else’s benchmark.
- Fixing the page instead of the step. Teams often redesign an entire landing page when only the call to action or the load time was broken. A full redesign introduces new risk and new variables, exactly what the decision rule above tells you to avoid.
- Treating a one-time test as a permanent answer. Traffic mix, season and audience shift over time, so a fix that worked once can quietly stop working. Re-check your four measurement numbers every few months rather than assuming a past fix still holds.
What This Looks Like in Practice
Google’s published Core Web Vitals case studies are useful because they name real companies with disclosed, measured outcomes, not anonymous “a client of ours” stories. Tokopedia, a large e-commerce marketplace, improved its Largest Contentful Paint score by 55%. Average session duration on the same traffic rose 23% afterward. Cdiscount improved all three Core Web Vitals and recorded a 6% revenue uplift.
Neither company changed its offer, its price, or its traffic sources. They removed friction between an interested visitor and the content that would have converted them, the same way a well-run conversion rate optimisation process targets one leak at a time. The honest limit: these are single-company results published by the businesses and by Google, not a controlled study across many sites. Treat the exact percentages as directional, not a guarantee for any other site.
Frequently Asked Questions About Website Optimisation
What is website optimisation?
Website optimisation is the process of finding and removing the specific points where visitors stop moving toward a purchase or goal. It covers the value proposition, the call to action, and page speed. It also covers audience match, content credibility, and whether a visitor can see the product or service in action.
How is website optimisation different from SEO?
SEO brings visitors to the page. Website optimisation decides what happens once they arrive. A page can rank first and still convert poorly if its value proposition, speed or call to action are weak, so both need separate attention and separate metrics.
What should I fix first?
Find the single step in your funnel with the largest percentage drop-off between two stages. Fix that one cause before touching anything else, rather than running every tactic on a generic checklist at once.
Does page speed really affect conversion rate?
Yes. Google’s published Core Web Vitals case studies record real revenue and conversion changes from speed fixes alone. Vodafone Italy saw an 8% sales increase, and Tokopedia saw a 23% session-duration increase, each from its own speed fix. Separate research cited by Nielsen Norman Group found mobile bounce probability rises 32% as load time goes from one second to three.
How often should I review website optimisation?
Review bounce rate, conversion rate by source, and Core Web Vitals monthly. Small regressions, like a new script or a heavier image, build up quietly. A deeper content and value-proposition review once or twice a year is usually enough, unless a metric moves sharply between reviews.
Can small businesses do website optimisation without a big budget?
Yes. The value proposition, call to action and audience-match fixes above cost time, not money. Baymard’s checkout-usability findings show usability fixes, not bigger ad budgets, recovered the largest share of lost orders in the sites studied.
How many changes should I test at once?
One. Testing several changes in the same release makes it impossible to know which one moved the result, good or bad. Ship a single fix, let it run for at least a full week of normal traffic, then decide whether to keep it before starting the next one.
Is a high bounce rate always a problem?
Not always. A page meant to answer one question quickly, like a definition or a contact address, can have a high bounce rate and still succeed. Treat bounce rate as a problem only when it is high on a page meant to lead somewhere else, such as a product or landing page.
Next Step: Diagnose One Page Before You Change Anything
Pick your highest-traffic page that is meant to convert. Check its bounce rate by source and its Core Web Vitals score, then match what you find against the six causes above. Fix the one cause the data points to, measure the four numbers again, and only then move to the next page. Diagnose, fix one cause, measure, repeat. That sequence is what turns website optimisation from a checklist into a result.
If you want structured practice applying this kind of diagnostic thinking, consider the Master Diploma in Digital & AI Marketing from Digital Marketing Skill Institute. It covers nine practical courses, including on-page optimisation and analytics, across SEO, content, paid and conversion work. It comes with unlimited 1-on-1 coaching and mentoring, plus real project work inside a U.S. company. The diploma is dual US and UK accredited. It is recognised in more than 100 countries and delivered 100% online, so you can study and apply it anywhere in your country.
Explore the curriculum on digitalmarketingskill.com, or go straight to the application page to get started wherever you live. You can also browse more practical guides on the Digital Marketing Skill Institute blog, or read verified outcomes on the reviews page. Come back to digitalmarketingskill.com any time you need the next guide in this series.
Every figure in this guide was checked against its original source before publication. Figures marked as illustrative are invented examples, not real results.
![9 Amazing Digital Marketing Skills to Make Money Online [With Proof]](https://digitalmarketingskill.com/wp-content/uploads/2019/07/9-Amazing-Digital-Marketing-Skills-to-Make-Money-Online-With-Proof-17.png)






