
Email open rates tell you whether a message got attention. On their own, though, they no longer prove a person read it. This guide explains what really moves email open rates, why the number is less trustworthy than it used to be, and the one metric to track instead once more than half your list reads mail on an Apple device.
Key Takeaways
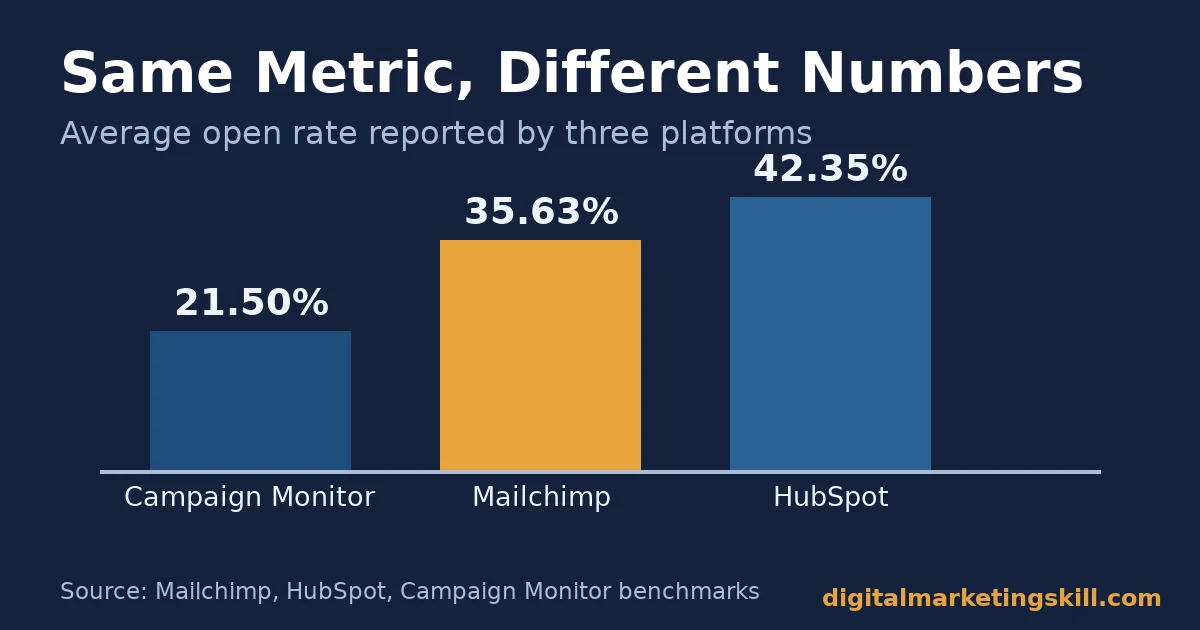
- Benchmarks disagree by more than 20 points. Mailchimp puts the all-industry average open rate at 35.63%, HubSpot reports 42.35%, and Campaign Monitor reports 21.5% for the same kind of average. Comparing your number to one published benchmark is misleading.
- Apple Mail inflates the number for everyone. Litmus reports that over 50% of email opens now happen on a device with Apple’s Mail Privacy Protection active. That feature marks a message “opened” the moment it downloads, whether or not anyone reads it.
- The sender matters more than most subject lines. Litmus, citing Constant Contact, reports that 45% of subscribers decide whether to open an email based on who they think it is from, before they read the subject line at all.
- Segmentation has a real, measured payoff. Omnisend reports that 90% of marketers who segmented their email audience saw improved campaign performance, in a survey run by Litmus.
- Preview text is shorter than you think. On mobile Gmail and Yahoo, roughly 40-50 characters of preview text show before the rest is cut. Desktop Gmail shows about 100-110 characters, according to Enchant, so the first few words have to carry the message.
In this guide
- What Most Advice On Email Open Rates Gets Wrong
- How An Email Open Is Actually Counted
- What Changes The Email Open Rate You Should Expect
- How To Lift Email Open Rates For Each Sender Type
- The Factor Most Guides Skip: Whether The Email Even Reaches The Inbox
- How To Measure Email Open Rates Honestly
- The One Decision Rule: Track Click-To-Open Once Apple Mail Passes Half Your List
- A Real Case: Turning Email Skills Into Paid Client Work
- A Simple Monthly Checklist For Healthier Email Open Rates
- Frequently Asked Questions About Email Open Rates
- Build These Skills Into a Career, Not Just a Checklist
What Most Advice On Email Open Rates Gets Wrong
Most articles on email open rates hand you subject line tricks and one “good” benchmark number. Then they move on. That advice fits a mailbox that barely exists anymore. A growing share of opens are now recorded by the recipient’s mail app itself. No human reading is required.
This guide starts from that shift instead of treating it as a footnote. Read every benchmark figure below as one company’s own sending data, not a universal standard. Mailchimp, HubSpot and Campaign Monitor each pull from a different mix of customers and industries. That is exactly why their averages disagree. Treat every number here as a snapshot to compare against your own list over time, not a score you pass or fail. The goal of this guide is practical, not academic: give you a short list of changes that genuinely move the number, and a way to tell when the number itself has stopped being worth chasing.
How An Email Open Is Actually Counted
An email open is not a reader’s decision measured directly. Most email platforms embed a tiny, invisible tracking pixel inside the message. When that pixel loads from the sender’s server, the platform logs an “open” against that recipient. The assumption is simple: a loaded image means a human looked at the email.
That assumption held up reasonably well for years. Then Apple introduced Mail Privacy Protection, and the assumption broke. Mailchimp’s own support documentation explains it plainly: with Apple MPP enabled, “emails present in Apple Mail are reported as ‘opened,’ regardless of the contact’s activity, resulting in inflated and inaccurate open rates.” Apple’s mail app pre-loads every image, including the tracking pixel, through its own proxy servers. It does this as soon as a message arrives, not when a person actually opens it.
Litmus tracks email client usage across billions of opens. It reports that over 50% of email opens now happen on a device with Apple MPP active. That single feature can move your reported open rate on its own, regardless of anything you change in your subject line or send time. This is why the guide treats open rate as a directional signal, not a precise score. For a deeper look at why the metric itself can mislead, see our guide on email marketing metrics and why open rate is lying to you.
What Changes The Email Open Rate You Should Expect
Not every list should expect the same number. Comparing two very different senders against one benchmark wastes the comparison. The two sender types below behave differently enough that each needs its own expectation, and its own fix.
Broadcast Senders: Built For Reach, Not Relevance
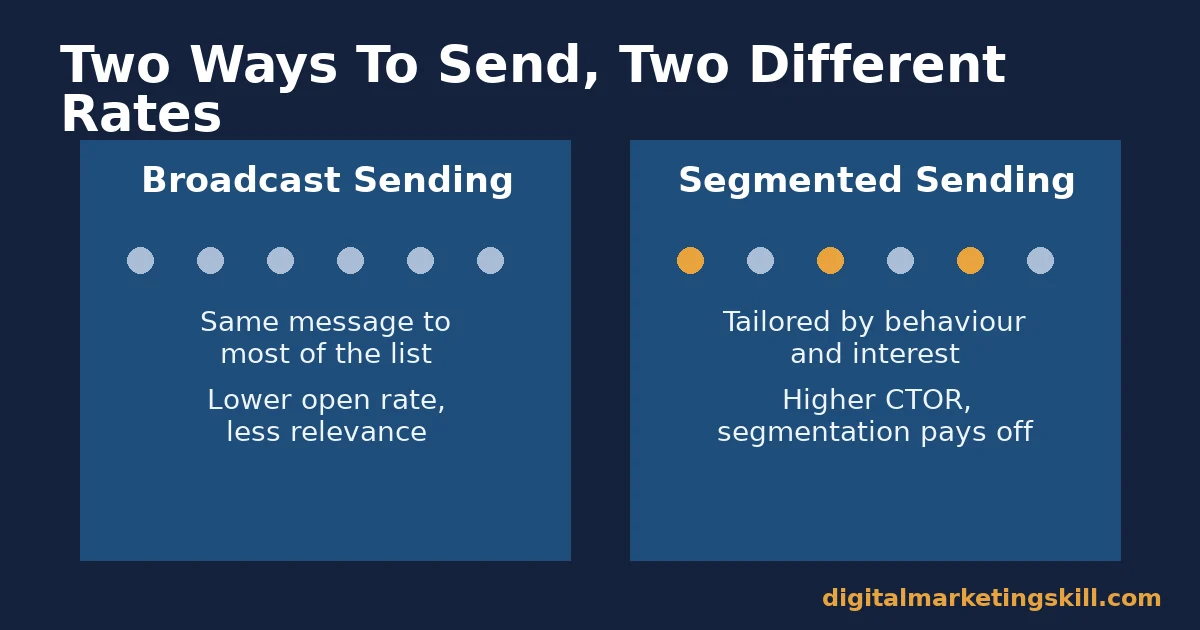
A broadcast sender sends the same message to most or all of its list on a fixed schedule. Segmentation, if it exists at all, is limited to basic demographics. This approach is simple to run. It reaches everyone fast, which is exactly its appeal for a small team.
The cost shows up in the open rate. The same subject line and content go to recent customers and year-old leads alike. A large share of recipients have no current reason to care. So email open rates for broadcast sends tend to sit toward the lower end of the 21.5% to 42.35% range the benchmarks above describe.
Segmented Senders: Built For Relevance Over Raw Volume
A segmented sender splits its list by behaviour: purchase history, engagement level, or the specific lead magnet someone downloaded. Content and subject lines are tailored to each group. It takes more setup work than a single broadcast send.
That setup work is exactly what the Litmus-run survey cited by Omnisend measured. Ninety percent of the marketers who segmented their audience reported improved campaign performance. Segmentation does not change how Apple MPP counts opens. It does change how many of the remaining, genuinely human opens turn into clicks, which is the number that still means something.
How To Lift Email Open Rates For Each Sender Type
The fix for each sender type follows directly from what makes it weak. Read the section that matches how you send today. Apply the other section once that first change has settled in.
Broadcast Senders: Lead With List Hygiene And Timing
Start by removing subscribers who have not opened or clicked anything in the last six months. A smaller, cleaner list produces a higher and more honest open rate than a larger, stale one. Inactive addresses drag the average down without ever being reachable.
Fix timing next, before you touch the subject line. Most mailbox providers process the bulk of daytime mail on weekdays. Test two or three weekday send times against your own list, rather than copying someone else’s “best time.” That is the fastest way to find what actually moves your number.
Segmented Senders: Lead With Personalization And Pre-Header Copy
If you already segment, the next lift usually comes from what a recipient sees before opening: the sender name and the preview text. Litmus, citing Constant Contact, found that 45% of subscribers decide to open based on who they think the email is from. A recognisable, consistent “from” name is worth fixing before any subject line test, and it costs nothing to change beyond updating one field in your sending platform.
Then tighten your preview text. Desktop Gmail shows roughly 100-110 characters of it. Mobile Gmail and Yahoo cut that to around 40-50 characters. Put the one sentence that matters most inside those first 40 characters, rather than letting your email platform auto-fill it from the body.
The Factor Most Guides Skip: Whether The Email Even Reaches The Inbox
A perfect subject line cannot be opened if the message never reaches the inbox. Open rate numbers only cover delivered mail, so a rising share of silent blocks or spam-folder drops can sit underneath a “normal-looking” open rate without you noticing.
Google’s own bulk sender requirements set the bar plainly: any sender pushing more than 5,000 messages a day to Gmail accounts must set up SPF, DKIM and DMARC authentication for its sending domain, and keep its spam rate, as reported in Postmaster Tools, below 0.30%. Google recommends staying under 0.10% for safety.
These three checks matter for email open rates specifically. SPF and DKIM prove a message really came from your domain. DMARC tells mailbox providers what to do with mail that fails that check. Skip any one of them, and a growing share of your sends can land in spam before a subscriber ever sees a subject line, which drags down open rate for reasons that have nothing to do with your copy. If you are choosing a platform to handle that volume responsibly, our guide to bulk email services covers what to look for.
How To Measure Email Open Rates Honestly
The open rate itself is distorted. Measuring it well means reading it alongside a few other numbers, each defined plainly below, rather than trusting it alone.
Five Metrics That Show What Is Really Happening
- Open rate. The share of delivered emails that triggered a tracking pixel load. Read it as a rough, inflated signal of reach, not of attention, once Apple Mail is a large share of your list.
- Click-to-open rate (CTOR). The share of opens that led to a click: clicks divided by opens. A click requires a genuine action, so CTOR survives Apple’s pixel pre-loading far better than open rate does. This guide treats CTOR as the primary signal. For the mechanics of lifting that number once attention is earned, see our guide to boosting email click-through rate.
- Unique open rate. Opens counted once per recipient, rather than every time a message is reopened. Use it instead of total opens when you compare campaigns. One curious recipient reopening an email five times should not skew the result.
- List decay rate. The share of your list that moves from engaged to unengaged over a set period, usually six months. A rising decay rate explains a falling open rate even when your subject lines have not changed at all.
- Unsubscribe rate. The share of recipients who unsubscribe from a given send. Mailchimp’s benchmark data puts a typical unsubscribe rate at roughly 0.22% for an all-industry average. A rate well above that on a single send is worth investigating before you send the next one, since a sudden spike usually points to a content or frequency problem rather than bad luck.
How To Read These Numbers Together
Start with CTOR, since it is the least distorted figure. If CTOR falls while open rate holds steady or rises, the subject line is still working. The content inside is not. Fix the email body next, not the subject line.
If open rate and CTOR fall together, suspect deliverability or list decay before blaming the subject line. Check whether a rising share of your sends are landing in a promotions tab or a spam folder. Either one would suppress both numbers at once. Our guide to email deliverability covers what Gmail, Yahoo, Outlook and Apple actually check before a message reaches the inbox.
The One Decision Rule: Track Click-To-Open Once Apple Mail Passes Half Your List
Take one rule from this guide and it should be this: once Apple Mail accounts for roughly half or more of your opens, which Litmus’s data suggests is already true for most senders, make click-to-open rate your primary weekly metric. Treat open rate as a secondary, directional number only.
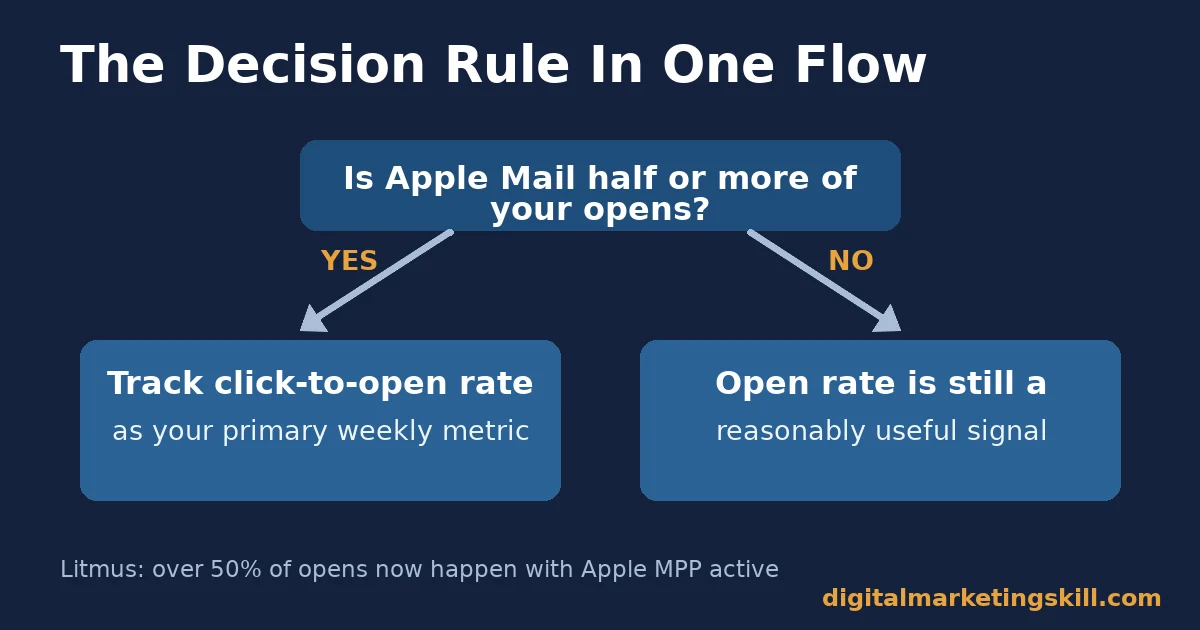
Here is an illustrative example, with invented numbers. A small newsletter sends to 10,000 subscribers and reports a steady 38% open rate for three months, in line with the benchmarks above. Its CTOR, however, drifts from 12% down to 7% over that same period. Judged by open rate alone, the newsletter looks healthy. Judged by CTOR, it is quietly losing the audience’s genuine interest, and that is the number the sender should act on.
A Real Case: Turning Email Skills Into Paid Client Work
Olajire Jacob is a Digital Marketing Skill Institute graduate. On the Institute’s reviews page, he described using email marketing skills from the training to find paying clients: “Fresh from the course, I was charging an average of $500 to set up email marketing flows for clients in the US, UK & Ca,” before scaling his services to around $5,000 a month, work he traces directly back to understanding how opens, clicks and list health fit together.
Treat the case as a demonstration of what a working email setup can be worth to a client. It is not a promise of a specific income. It describes one person’s results, and individual experience varies widely. The specific skill behind that result was practical, not theoretical: knowing how to set up automated email flows, write subject lines that match a client’s audience, and read campaign data well enough to show a client real progress. That combination, more than any single open rate trick, is what turns an email marketing hobby into billable client work. The Institute’s own earnings disclaimer is the accurate place to read about typical outcomes and the limits of any single story like this one.
A Simple Monthly Checklist For Healthier Email Open Rates
You do not need new software to apply everything in this guide. The checklist below takes roughly an hour a month, and it works for both broadcast and segmented senders.
- Remove the truly inactive. First, pull everyone who has not opened or clicked in six months, and either send one honest re-engagement email or remove them outright.
- Check your authentication. Next, confirm SPF, DKIM and DMARC are all still correctly set up for your sending domain, especially after any change of email platform.
- Fix the sender name before the subject line. Then make sure your “from” name is instantly recognisable, since that decision happens before a subscriber even reads your subject line.
- Tighten the first 40 characters of preview text. After that, rewrite preview text so the single most useful sentence appears before any mobile truncation cuts it off.
- Judge the result by CTOR, not open rate. Finally, compare click-to-open rate before and after each change, because open rate alone will not tell you whether the fix actually worked.
Repeat this checklist every month, and your email open rates become a steadier, more honest signal each time, instead of a number that moves for reasons you cannot see. None of these five steps requires new software or a bigger budget, which is exactly why they are worth doing before anything more advanced.
Frequently Asked Questions About Email Open Rates
What is a good email open rate?
There is no single correct figure. Mailchimp reports 35.63%, HubSpot reports 42.35%, and Campaign Monitor reports 21.5% as their own all-industry averages. Compare your email open rates against your own list’s history, rather than any one external benchmark.
Why are my email open rates higher than they used to be?
A jump in email open rates without any change in your content is usually Apple Mail Privacy Protection, not genuine extra interest. Litmus reports that over 50% of opens now happen on a device with that feature active. It counts a message as opened as soon as it downloads.
Should I stop tracking email open rates altogether?
No, but stop treating it as your main metric. Keep watching open rate for big, sudden swings that might signal a deliverability problem. Use click-to-open rate as the number that actually reflects reader interest.
Does subject line personalization really improve email open rates?
It can help, but the sender name usually matters more. Litmus reports that 45% of subscribers decide whether to open based on who they think an email is from. Fix a consistent, recognisable “from” name before personalizing the subject line itself.
How often should I clean my email list to protect open rates?
Review engagement every six months. Remove or re-engage subscribers who have not opened or clicked in that window. A smaller, active list produces more honest email open rates than a large, stale one.
What is click-to-open rate and how is it different from open rate?
Click-to-open rate, or CTOR, is the share of opens that led to a click: clicks divided by opens. Unlike open rate, a click requires a real action, so CTOR is far less distorted by automatic pixel loading.
Does the time I send an email affect its open rate?
Yes, but the effect is specific to your own audience, not universal. Test two or three weekday send times against your own list. Compare click-to-open rate, not just open rate, before settling on a schedule.
Why do Mailchimp, HubSpot and Campaign Monitor report such different open rate averages?
Each company’s benchmark comes from its own customers, who differ by industry mix, list size and send frequency. None of the three numbers is wrong. They simply describe different populations of senders, which is why your own list’s history is a better comparison than any single published figure.
Does landing in the Gmail Promotions tab lower my open rate?
It can, because fewer people check that tab as frequently as the primary inbox. However, Google’s own guidance treats tab placement as separate from spam filtering, so a promotions-tab email is still delivered and still counted if opened. The bigger risk is the spam folder, not the promotions tab, since a spam-foldered email is rarely opened at all.
Build These Skills Into a Career, Not Just a Checklist
Reading email open rates correctly is one skill inside a much bigger discipline. The Master Diploma in Digital & AI Marketing at Digital Marketing Skill Institute gives structured, hands-on practice in email marketing alongside the rest of digital and AI marketing. It includes an AI-Powered Lead Generation and Email Automation track, one of four AI-powered tracks totalling ten courses, with a Full Stack option for completing all four.
The programme comes with unlimited 1-on-1 coaching and mentoring, and a U.S. Project Internship that produces a verified U.S. Work Reference Letter. It is dual US and UK accredited, and recognised in more than 100 countries. The programme runs 100% online, so you can study from anywhere in your country.
Browse more guides on the Digital Marketing Skill Institute blog, read more outcomes on the reviews page, or when you are ready, apply for the Master Diploma directly from Digital Marketing Skill Institute.
Every figure in this guide was checked against its original source before publication. Figures marked as illustrative are invented examples, not real results.
![9 Amazing Digital Marketing Skills to Make Money Online [With Proof]](https://digitalmarketingskill.com/wp-content/uploads/2019/07/9-Amazing-Digital-Marketing-Skills-to-Make-Money-Online-With-Proof-17.png)






