
A Marketing Report is a document or dashboard that shows how your marketing performed over a set period, using data, charts and short notes on what to do next. Without one, you are guessing which channels work. With one, you can see where money and effort pay off and where they don’t. As a result, a good marketing report turns raw numbers into clear decisions for you, your manager or your client.
Key Takeaways
- A marketing report shows results for a set period, such as a week, month or campaign.
- The best reports link numbers to business goals, not just to clicks and likes.
- Most reports pull data from tools such as Google Analytics, ad platforms and email software.
- A short summary and clear next steps matter as much as the charts.
- Different readers need different reports, so match the detail to your audience.
What Is a Marketing Report?
Every marketing activity creates data. For example, ads collect clicks, emails collect opens and websites collect visits. However, that data sits in many tools and means little on its own. A marketing report gathers the most useful numbers in one place. Then it explains what they mean.
Think of it like a school report. It doesn’t list every piece of homework. Instead, it gives grades for each subject, a short comment and a plan for next term. In the same way, a marketing report gives results for each channel, a short comment and a plan for the next period.
Reports come in many forms. Some are a single slide for a busy director. Others are live dashboards that update every day. Also, some are long monthly reviews for a client. Whatever the format, the aim is the same: help someone make a better decision.
Much of the data comes from analytics tools. Google says its Analytics product “collects data from your websites and apps to create reports that provide insights into your business.” So a marketing report often starts there, then adds data from ads, email and sales.
Why It Matters
Why do marketing reports matter so much? First, they show whether your budget is working. Second, they help you spot problems early, such as a sudden drop in traffic. Third, they build trust with managers and clients. In addition, they give you evidence when you ask for more budget. Without a report, even great work can look like guesswork.
How a Marketing Report Works
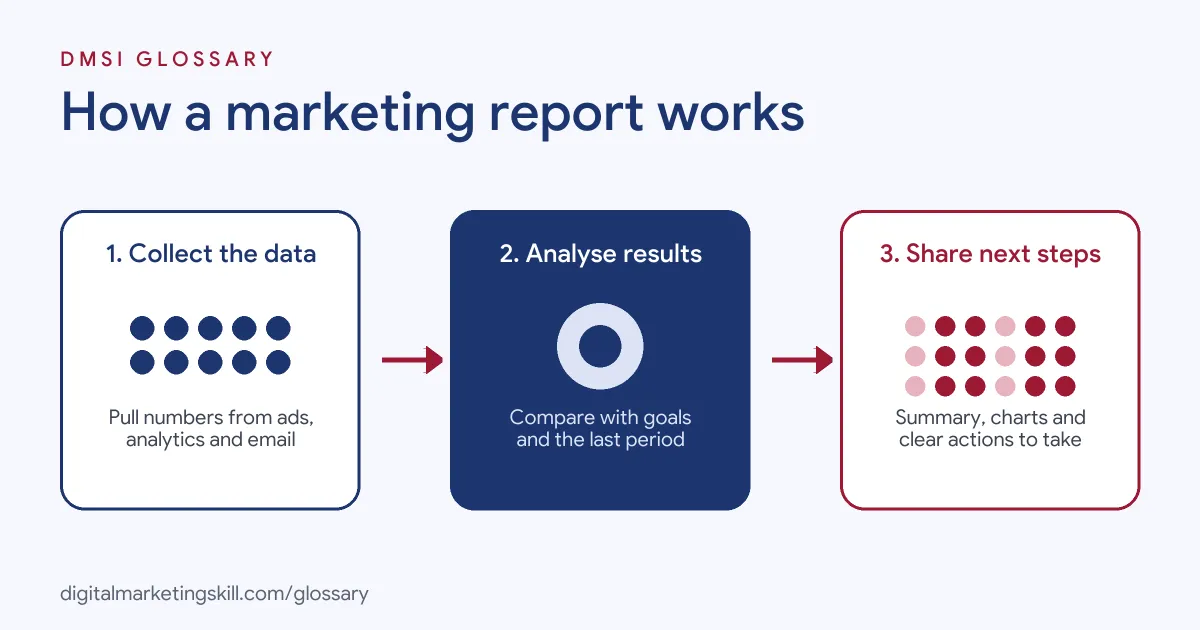
A marketing report follows a simple flow. First you collect data, then you analyse it, and finally you share what you found. Each step builds on the one before, so a weak step early on weakens the whole report.
Step 1: Collect the Data
To start, you pull numbers from each tool you use. For example, that might be website traffic from Google Analytics 4, spend and clicks from Google Ads, and opens from your email platform. Clean tracking is vital here. So check that UTM parameters and conversion tags work before you trust the numbers.
Step 2: Analyse the Results
Next, you compare results against goals and past periods. Did leads go up or down? Which channel brought the cheapest sales? Also, look for reasons behind any big change. For instance, a jump in traffic may come from one viral post. Then decide what each change means for the business.
Step 3: Present and Share
Finally, you turn your findings into something easy to read. Usually that means a short summary, a few charts and a list of next steps. Many tools can send reports for you. For example, Google Ads states that “You can schedule your reports to be emailed to you or other people who have access to your account at specific times.” So your readers get updates without having to ask.
What Goes Inside
Most reports share the same core parts. There is a summary, the main key performance indicators, results by channel, insights and next steps. In addition, many reports compare this period with the last one. That way, readers can see the trend at a glance.
Common Types of Report
Reports often focus on one channel or one goal. For example, a paid ads report covers spend, clicks, conversion rate and cost per lead. Similarly, an SEO report covers rankings, organic traffic and top pages. An email report looks at opens, clicks and unsubscribes. Then there is the social media report, which tracks reach, engagement and follower growth. Finally, a full marketing report brings all of these together for senior readers. As a rule, the higher the reader, the shorter the report should be. So a director may want one page, while a channel specialist may want every detail.
Examples of Marketing Reports
- A weekly paid ads report for a local gym. The report shows spend, leads and cost per lead for Google and Meta ads. It also flags one ad that stopped working. As a result, the team pauses it and moves budget to the best ad.
- A monthly SEO report for an online shop. It tracks organic traffic, top landing pages and sales from search. Then it lists three pages to improve next month.
- A campaign wrap-up report for a charity. After an email appeal, the report shows open rate, click rate and donations. It also notes which subject line worked best. So the next appeal can build on that lesson.
Marketing Report vs Marketing Dashboard
| Point | Marketing Report | Marketing Dashboard |
|---|---|---|
| Timing | Covers a set period, such as a month | Updates live or daily |
| Main job | Explains results and recommends actions | Shows current numbers at a glance |
| Commentary | Includes written insights | Usually charts only |
| Best for | Managers, clients and reviews | Daily checks by the marketing team |
In practice, many teams use both. A marketing dashboard tracks the numbers every day, while the report tells the story behind them.
How to Create a Marketing Report
- Know your reader. Ask who will read it and what decision they need to make. Then cut anything that doesn’t help.
- Pick a few key metrics. Choose numbers tied to goals, such as leads, sales or return on investment.
- Set the period. Decide whether the report is weekly, monthly or per campaign.
- Gather the data. Pull numbers from each tool. Also, check that tracking worked across the whole period.
- Build the charts. Use a tool such as Looker Studio or a spreadsheet. Keep each chart simple.
- Write the summary. In three or four sentences, say what happened, why and what you will do next.
- Add next steps. List clear actions, each with an owner.
- Share and review. Send the report on a regular schedule. After that, ask readers what would make it more useful.
Best Practices for Marketing Reports
- Lead with the summary. Busy readers may only read the first few lines, so put the key message there.
- Tie numbers to goals. Show how results compare to targets, not just to last month.
- Use context. A number alone means little, so add a comparison or a short note.
- Keep charts clean. One idea per chart works better than a crowded screen.
- Explain the why. Say what caused a change, or say that you are still checking.
- Stay consistent. Use the same layout each time, so readers can spot trends fast.
Common Mistakes to Avoid
- Reporting vanity metrics. Likes and impressions look nice, but they rarely show business value on their own.
- Too much data. A report with fifty charts hides the few that matter.
- No next steps. If a report doesn’t lead to action, it is only a record.
- Trusting broken tracking. Missing tags or wrong UTM codes can make results look better or worse than they are.
- Hiding bad news. Readers trust you more when you explain a drop honestly and share a fix.
Where You’ll Use Marketing Reports at Work
Reporting is part of almost every marketing role, from affiliate and ads specialists to client success teams. For example, real remote job listings ask you to:
- “Prepare regular performance reports and provide recommendations for continuous improvement.” (Affiliate Manager).
- “Provide performance reports and strategic recommendations to improve results.” (Meta & Google Ads Specialist).
- “Prepare regular campaign reports and check data for accuracy before sharing it with the Client Success team.” (Client Success Operations Coordinator).
Learn It in the Google Ads and Analytics Track
You can practise building marketing reports with real data in the AI-Powered Google Specialist track. Every track includes a U.S. Project Internship from day one, with unlimited 1-on-1 mentoring.
Frequently Asked Questions
What should a marketing report include?
Include a short summary, key metrics, results by channel, insights and next steps. Also, compare results with goals or the last period.
How often should I send a marketing report?
Most teams send one weekly or monthly. However, campaign reports usually go out when the campaign ends.
What tools can I use to build a marketing report?
Common choices include Google Analytics, Looker Studio and spreadsheets. In addition, most ad and email platforms have their own reporting features.
What is the difference between a report and a dashboard?
A dashboard shows live numbers at a glance. By contrast, a report covers a set period and explains what the numbers mean.
Which metrics matter most?
The ones tied to your goals. For example, an online shop may focus on sales and revenue, while a service business may focus on leads.
Sources: Google Analytics Help: Overview of Google Analytics reports; Google Ads Help: Create custom reports in Report Editor; Google Cloud: Data Studio documentation; remote job listings on Himalayas, Himalayas and Himalayas.