

Content marketing metrics only matter if they change what you do next. A follower count or a page view total feels good, but it rarely tells you what to fix. This guide shows which content marketing metrics actually predict business results. It also shows how they differ from the ones that only look impressive, and one rule for picking what to track.
Key Takeaways
- Measurement is still the hard part. Content Marketing Institute surveyed 1,015 B2B marketers. It found measuring content effectiveness is a top-three challenge, close behind creating enough content and limited resources.
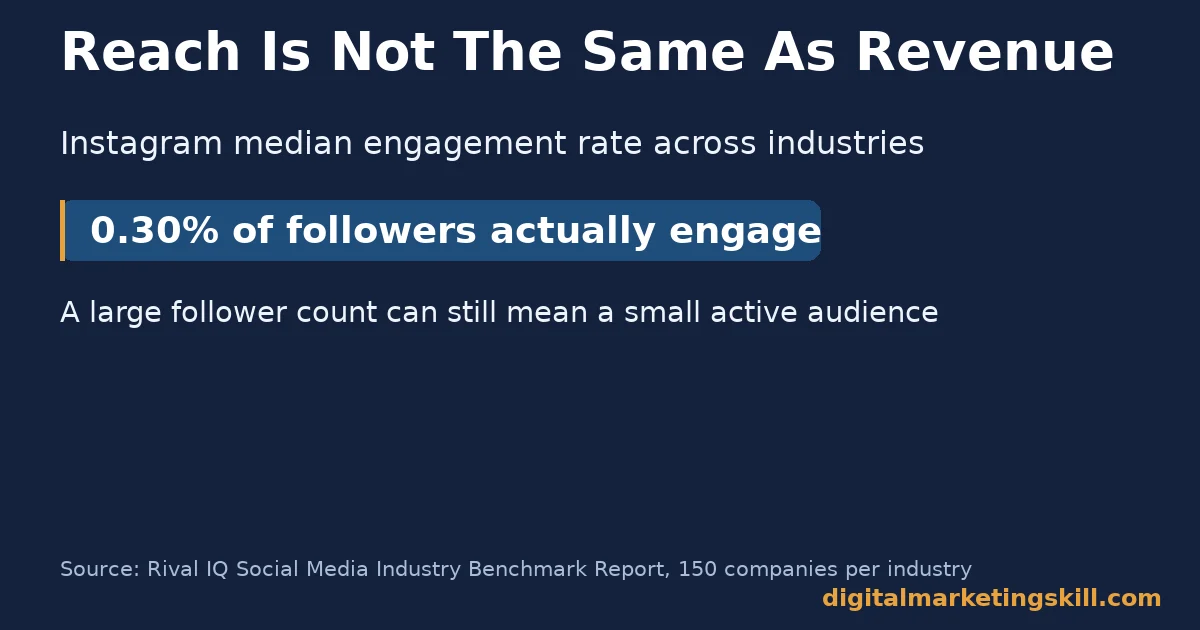
- Big follower counts hide tiny engagement. Rival IQ’s latest benchmark covered 150 companies in each of 14 industries. It found the all-industry median Instagram engagement rate was just 0.30% of followers.
- Not all metrics are equal. Analyst Avinash Kaushik splits metrics into three buckets: efficiency, vanity and effectiveness. He warns that vanity metrics “don’t enable us to identify or quantify the impact of our actions.”
- Thought leadership gets measured two ways. Content Marketing Institute’s research found 80% of B2B marketers track audience engagement. 63% also track business impact, such as leads and pipeline.
- A real shift can take years, not weeks. One company’s documented pivot from story-based content to buying-intent content took about two and a half years to reach 225 signups a month from the blog.
In this guide
- Why Vanity Metrics Still Win By Default
- What Makes a Metric Actionable
- How To Lead With Each Type Of Metric
- Four Content Marketing Metrics Worth Tracking
- The One Decision Rule: Ask What Decision The Number Would Change
- A Simple Way To Start Tracking These Metrics
- Common Mistakes That Undermine Content Marketing Metrics
- A Real Case: A Content Shift That Took Years, Not Weeks
- Frequently Asked Questions About Content Marketing Metrics
- Build This Into Your Marketing
Why Vanity Metrics Still Win By Default
Most content reports lead with the easy numbers: page views, followers, shares. These numbers are not wrong, but they are not the point either. Instead, they describe attention, not outcome.
Content marketing metrics default to vanity because vanity numbers are easy to get and easy to present. A traffic chart going up and to the right looks like success in a slide. It says nothing about whether any of those visitors became a lead, which is also why raw traffic alone is a weak way to judge our guide to traffic building techniques.
Google’s own guidance on helpful content makes the same point from a different angle. It asks whether a reader would bookmark or recommend the page, not how many people merely saw it.
Here are the ground rules for this guide. Every statistic is attributed to a source we opened directly. The case study describes one company’s result on its own market, not a guarantee. Any number that is only our own estimate is labelled illustrative.
What Makes a Metric Actionable
A metric earns a place in your report when it does two things. First, moving in one direction has to trigger a real decision. Second, it has to connect, even loosely, to revenue or cost. So if a number cannot do both, it does not belong on the dashboard.
Analyst Avinash Kaushik calls the opposite kind of number “super lame”: a metric that looks related to your work but cannot be acted on. His alternative, “super awesome” metrics, track things like reader comments per post or replies per day, numbers tied to real engagement rather than raw reach.
Awareness Metrics: Built to Look Good
Awareness metrics, such as impressions, followers and page views, are built to grow steadily and look good over time. Also, they are easy to screenshot and easy to compare month over month. That is exactly why they get overused.
The problem is scale without context. Rival IQ’s latest benchmark, covering 150 companies in each of 14 industries, found the all-industry median Instagram engagement rate was only 0.30% of followers. A brand with 500,000 followers and that median rate gets real interaction from roughly 1,500 people. The follower count alone hides that.
Revenue Metrics: Built to Prove Value
Revenue metrics, such as qualified leads, pipeline influenced and content-assisted sales, are built differently. They take more effort to track because they need a connection between a piece of content and a business outcome.
That connection is also what makes them worth the effort. Content Marketing Institute’s survey found 56% of B2B marketers list attributing ROI to content as a top challenge. That is exactly why fewer teams track these numbers well, and why the few that do stand out, including teams that connect content to email list growth as a measurable, intermediate goal.
How To Lead With Each Type Of Metric
Each type needs a different presentation, not a different spreadsheet. The fix is not to ignore awareness metrics. It is to stop presenting them alone.
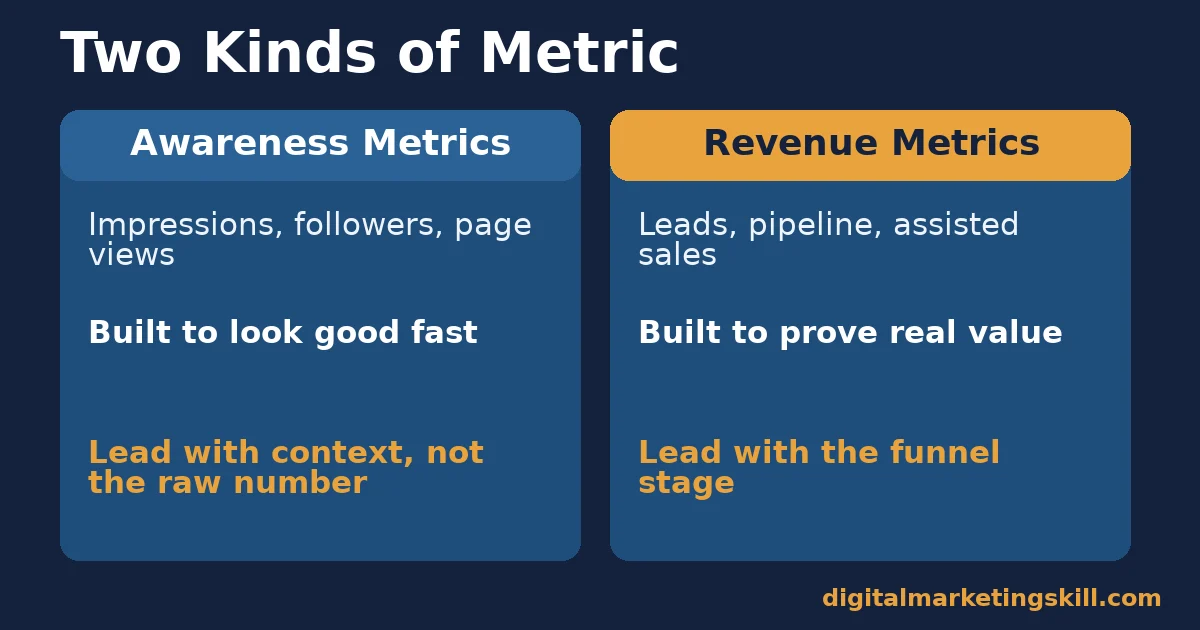
Awareness Metrics: Lead With Context, Not the Raw Number
Never show a follower count or page view total on its own. Instead, pair it with a rate: engagement rate, not total engagements; return visitor rate, not total visits. A rate tells you whether quality is improving. A raw total only tells you whether volume grew.
When you do report a raw number, say what it is not. “40,000 page views, with no attributed leads yet” is more honest, and more useful, than “40,000 page views” alone.
Revenue Metrics: Lead With the Funnel Stage
Tie every revenue metric to a specific stage: a lead, a qualified lead, an opportunity, a closed sale. A single “conversions” number hides whether your content is filling the top of the funnel or closing deals at the bottom.
Report revenue metrics next to the content type that produced them. A comparison guide and a how-to post rarely perform the same way, so a blended average across all content types hides which format is actually working.
Four Content Marketing Metrics Worth Tracking
Pick metrics that answer a specific question, not metrics that are simply easy to pull. These four cover most of what content marketing metrics should actually tell you.
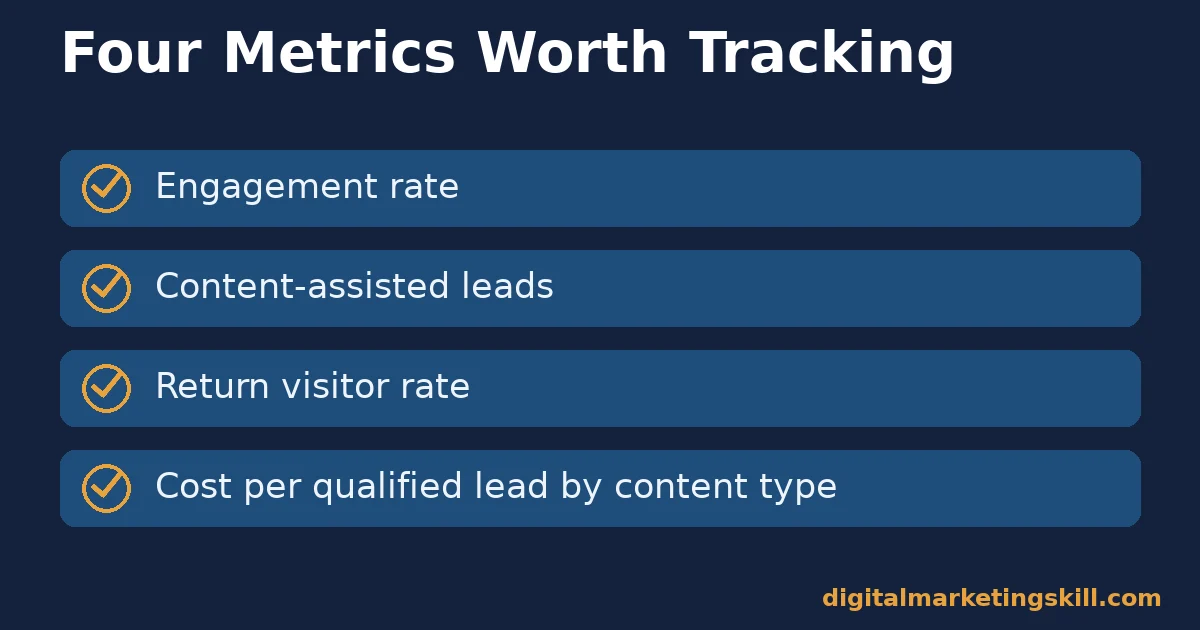
- Engagement rate. Interactions divided by reach or followers. This shows whether people who see your content actually respond to it, which a raw follower count cannot show.
- Content-assisted leads. Leads that touched a piece of content somewhere in their journey, even if it was not the final conversion point. This credits content for the role it actually plays, the same role our guide to post-purchase engagement covers after the sale.
- Return visitor rate. The share of readers who come back. A rising rate signals content worth returning for, which matters more long-term than a single traffic spike.
- Cost per qualified lead by content type. Splitting cost per lead by format shows which content types are worth producing more of, and which are consuming budget without payoff.
Track these four together. Rising engagement rate with flat content-assisted leads tells you people like the content but it is not reaching the right audience to convert.
The One Decision Rule: Ask What Decision The Number Would Change
Before you add a metric to your report, ask what decision would change if that number moved. If no decision would change, drop the metric, no matter how good it looks.
Here is an illustrative, invented example. A dashboard shows 10,000 monthly page views, flat for three months. No one on the team can say what they would do differently if that number went to 12,000 or dropped to 8,000. That number should not be on the dashboard. A cost-per-qualified-lead figure, by contrast, tells the team exactly which content type to produce more of.
Apply the rule to your current report. For every metric on it, write one sentence: “If this number moved, we would do X.” If you cannot finish that sentence, replace the metric.
A Simple Way To Start Tracking These Metrics
Good content marketing metrics need a basic tracking setup before they mean anything. Here is a simple starting point, even for a small team.
- Tag every link. Add UTM parameters to links you share in email, social and ads, so traffic from each source is easy to isolate later.
- Add a content field to your CRM. Record which piece of content a lead first engaged with, even a simple dropdown field. This is what makes content-assisted leads measurable.
- Set a review cadence. Pick a fixed interval, such as every two weeks, to look at your four core metrics together. Consistency matters more than frequency.
- Write the decision test next to each metric. Keep the one-sentence test from the decision rule above visible on the report itself, so nobody forgets why a number is there.
None of this requires expensive tooling. A spreadsheet with consistent tags and a fixed review date will outperform an elaborate dashboard nobody checks.
Common Mistakes That Undermine Content Marketing Metrics
A few habits quietly make good content marketing metrics useless. Watch for these before your next report.
- Reporting totals instead of rates. A rising total can hide a falling rate. Always pair a raw number with the rate it is built from.
- Comparing month to month instead of year over year. Seasonal spikes skew short comparisons. A holiday traffic bump is not a trend.
- Tracking everything instead of a few decisions. A twenty-metric dashboard dilutes attention. Four metrics tied to real decisions beat twenty that are not.
- Crediting the last click only. A single-touch attribution model undercounts content that influences a sale early, without being the final step. Google’s own guidance on attribution models recommends comparing a last-click view against a data-driven one to find undervalued content.
- Changing metrics every quarter. Content marketing metrics need a consistent baseline. Swapping them too often makes trends impossible to see.
A Real Case: A Content Shift That Took Years, Not Weeks
The marketing agency Grow and Convert documented its work on Leadfeeder’s blog, shifting it from story-based, top-of-funnel posts to what they call “Pain Point SEO”: content built around high-intent buying questions, such as product comparisons and alternative-to posts.
Over about two and a half years, the blog reached between 17,000 and 21,000 monthly organic sessions and scaled to more than 225 trial signups a month from content alone, around 12% of total signups. They prioritised buying intent over search volume, sometimes targeting keywords that showed zero volume in keyword tools.
The limits matter here. The authors themselves call a steady, month-over-month rise in conversions “extremely rare,” reached only through constant testing and iteration, not a fixed formula. Treat this as evidence that content marketing metrics can be moved deliberately, not as a guarantee of the same timeline or result.
Frequently Asked Questions About Content Marketing Metrics
What are the most important content marketing metrics to track?
Start with engagement rate, content-assisted leads, return visitor rate and cost per qualified lead by content type. These four answer specific questions that a raw traffic or follower total cannot.
Are page views a vanity metric?
On their own, yes. Page views become useful once paired with a rate, such as return visitor rate, or connected to a downstream outcome, such as leads generated from that traffic.
How do I measure content marketing ROI?
Connect content to leads or sales through consistent tracking, such as UTM parameters and a CRM field for content touch points. Then compare the cost of producing that content against the value of what it influenced.
Content Marketing Institute’s research found this remains one of the toughest challenges marketers report, so expect to refine the process over time. Pairing content with a clear email marketing strategy makes that connection easier to trace.
Should I stop tracking social media followers entirely?
No, but stop reporting the raw count alone. Pair it with engagement rate so a reader can tell whether that audience is actually responding, not just accumulating.
How often should I review content marketing metrics?
Review often enough to catch problems early, but compare trends year over year rather than month over month, since short windows get skewed by seasonal spikes.
What is the difference between a KPI and a vanity metric?
A KPI is tied to a specific business goal and a decision your team will act on. A vanity metric can move up or down without changing anything your team does, which is the core test for telling them apart.
Can a vanity metric ever be useful?
Yes, as a secondary signal. A rising follower count can show growing awareness, which is worth noting. The mistake is reporting it as proof of business results on its own, instead of as one data point among several.
How many content marketing metrics should I track at once?
Fewer than you think. Four to six metrics tied to clear decisions beat a long dashboard that nobody reviews properly. Add a metric only when you can also name the decision it will inform.
Build This Into Your Marketing
Choosing the right content marketing metrics is a skill, not a one-time dashboard setup. The Digital Marketing Skill Institute’s Master Diploma in Digital & AI Marketing covers this inside its ten-course, four-track program.
It comes with a Full Stack option for completing all four tracks, unlimited 1-on-1 coaching and mentoring, a U.S. Project Internship with a verified U.S. Work Reference Letter, and dual US and UK accreditation recognised in more than 100 countries. It runs 100% online, wherever in your country you happen to be.
Explore more practical guides on the Digital Marketing Skill Institute blog, read real outcomes on the reviews page, or go straight to the application page to start. Learn more about the Institute and its full course catalogue at digitalmarketingskill.com, any time, from anywhere.
Next step: open your current content report. Pick the metric you report most often, and write the one-sentence decision test from above. Fix or replace that metric before you add anything new. Then come back to digitalmarketingskill.com for the next guide on getting more from your content.
Every figure in this guide was checked against its original source before publication. Figures marked as illustrative are invented examples, not real results.
![9 Amazing Digital Marketing Skills to Make Money Online [With Proof]](https://digitalmarketingskill.com/wp-content/uploads/2019/07/9-Amazing-Digital-Marketing-Skills-to-Make-Money-Online-With-Proof-17.png)






