
Customer lifecycle marketing treats acquisition, conversion, retention and reactivation as one connected system. Most growth plans chase traffic and stop there. This guide shows where each stage actually breaks. It gives the fix for each stage, plus the one rule for deciding which to fix first.
Key Takeaways
- Existing customers convert far more easily. The book Marketing Metrics puts the probability of selling to an existing customer at 60-70%. A new prospect converts at just 5-20%.
- Retention moves profit more than acquisition. Bain’s research, published in Harvard Business Review, found that a 5% rise in customer retention increases profit by 25-95%.
- Checkout is where conversion quietly leaks. Baymard Institute’s analysis of 50 studies puts average cart abandonment at 70.19%. Unexpected costs are the top reason shoppers cited.
- Repeat buyers carry the business. RJMetrics’ ecommerce benchmark study found the typical online store earns 43% of revenue from repeat customers. Its top 1% of customers spend 30 times the average.
- Win-back email still works, modestly. Omnisend’s ecommerce report found lapsed-purchase emails average a 33% open rate and a 0.52% conversion rate.
In this guide
- The One-Metric Blind Spot In Most Growth Plans
- How Customer Lifecycle Marketing Actually Works
- Where Each Lifecycle Stage Breaks, By Symptom
- How to Fix Customer Lifecycle Marketing At Each Stage
- Measuring Customer Lifecycle Marketing Progress
- The One Decision Rule: Fix The Stage With The Biggest Revenue Gap First
- A Real Case: What RJMetrics Found Across Thousands Of Stores
- Frequently Asked Questions About Customer Lifecycle Marketing
- Build This Skill Into Every Campaign You Run
The One-Metric Blind Spot In Most Growth Plans
Here is the gap this guide closes. Most growth plans report one number: new visitors, new customers, or revenue. A single number hides which stage is working. It also hides which stage is quietly leaking money.
Customer lifecycle marketing fixes that. It tracks four stages separately: acquisition, conversion, retention and reactivation. A business can have healthy traffic and still shrink, if conversion or retention is broken underneath it.
Picture two businesses reporting the same 10% revenue growth. One earned it by acquiring more new customers while losing repeat buyers at roughly the same rate, a pattern that cannot continue once the acquisition budget stops rising. The other earned it mostly from existing customers buying more often, a pattern that keeps compounding even if new-customer growth slows. The blended number looks identical. Only a stage-by-stage view tells you which business you actually run.
Ground rules before you read further. Every figure here names the company or researcher that measured it, along with its scope. A benchmark from one study is a useful reference point, not a rule for every business. Treat the decision rule later in this guide as a starting method, not a fixed formula.
How Customer Lifecycle Marketing Actually Works
Customer lifecycle marketing maps every customer through four stages. Acquisition gets the right person to notice you. Conversion turns that person into a paying customer. Retention earns the second purchase, and the ones after it. Reactivation brings back customers who stopped buying.
The stages connect in both directions. A business with strong acquisition but weak retention keeps replacing customers it should be keeping. That pattern is expensive. Bain’s research, published in Harvard Business Review, found that raising customer retention by just 5% increases profit by 25% to 95%, depending on the industry. No acquisition campaign produces that kind of leverage on its own.
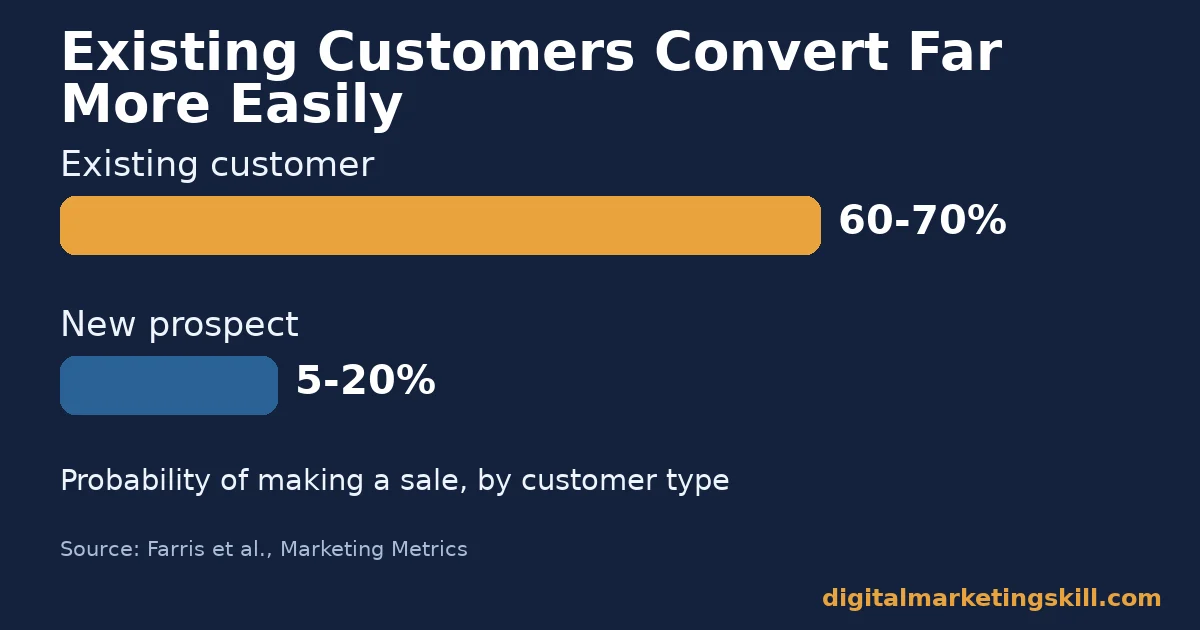
The reverse is also true. Paul Farris’s book Marketing Metrics puts the probability of selling to an existing customer at 60-70%. A new prospect converts at just 5-20%. That gap is why customer lifecycle marketing treats the second sale as a separate, measurable job. It is not an automatic result of the first one.
Where Each Lifecycle Stage Breaks, By Symptom
Each stage of customer lifecycle marketing fails in a different, recognisable way. Matching the symptom to the stage tells you where to focus first.
Acquisition: Built For Traffic, Not Fit
Acquisition problems show up as rising traffic with flat or falling revenue. The channel is bringing visitors, but not the right visitors. Paid channels are especially prone to this. Volume is easy to buy; fit is not.
A common cause is sending every channel to the same generic landing page. A visitor clicks a specific ad, then lands on a page that answers a different question. That visitor counts as acquired traffic but was never a real match for the offer.
The fix is not always to spend more on a channel that looks cheap per click. A channel can have a low cost per click and a low conversion rate at the same time, which still produces an expensive customer once you divide total spend by actual buyers. Track cost per acquired customer by channel, not just cost per click, to see this clearly.
Conversion: Built For Clicks, Not Checkout
Conversion problems show up between “interested” and “paid.” Baymard Institute’s analysis of 50 studies puts the average cart abandonment rate at 70.19%. Of shoppers who gave a reason for leaving, about 40% cited extra costs such as shipping, tax or fees appearing late in checkout.
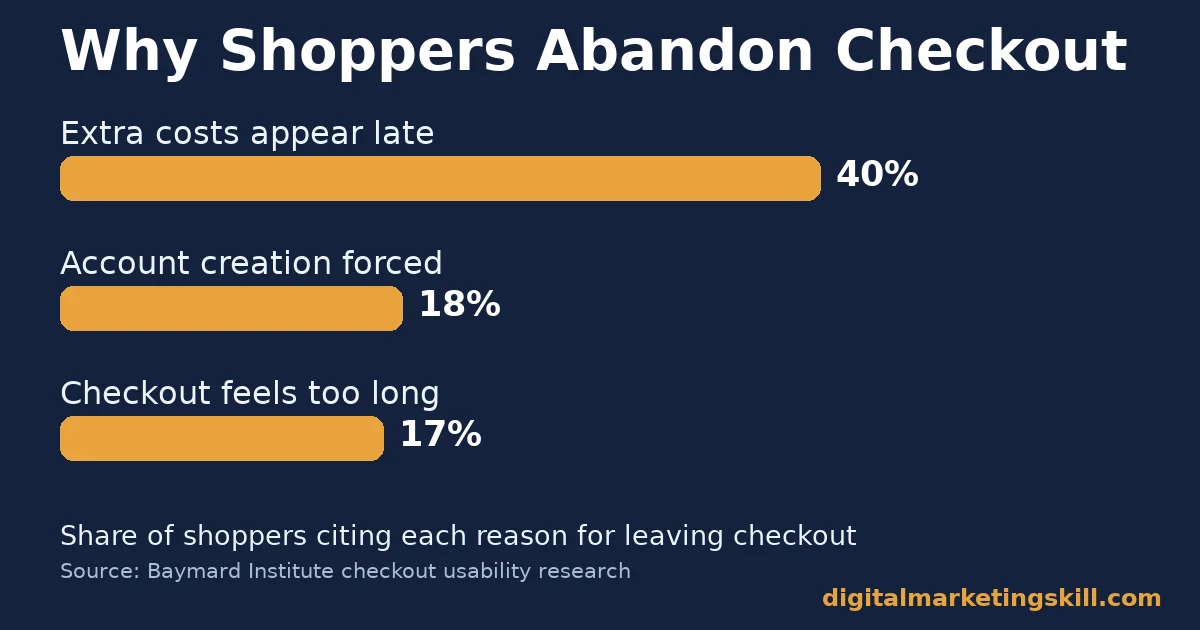
Forced account creation and a checkout that feels too long followed, cited by about 18% and 17% of shoppers respectively in the same research. None of these problems show up in a plain traffic report. They only show up in a funnel or checkout-specific one.
Retention: Built For The First Sale, Not The Second
Retention problems hide inside otherwise healthy revenue, because new customers keep replacing the ones who leave. RJMetrics’ ecommerce benchmark study found that the typical online store earns 43% of revenue from repeat customers. Some retailers earn far more.
When that share is low, the business is running hard to stand still. Constant acquisition spend is covering for customers who never came back.
Retention problems are also easy to miss in a dashboard that only shows total revenue growing year over year, since new customers can mask a shrinking base of repeat buyers for a long time. The first sign is usually a rising cost to hit the same revenue target, before the repeat purchase rate itself shows the drop.
Reactivation: Built For Discounts, Not Reasons
Reactivation problems look like a growing list of past customers who are never contacted again. Or they only ever receive a generic discount code. Omnisend’s ecommerce report found that lapsed-purchase emails still average a 33% open rate. The audience has not forgotten the brand, even after it stopped buying.
The conversion rate on those same emails was only 0.52% in the same data set. That gap signals the message, not the audience, is usually the weak link.
How to Fix Customer Lifecycle Marketing At Each Stage
Each stage above has a specific, matching fix. None of these fixes need a bigger budget first. They need a change in what gets measured and tested.
Fix the stages in the order your own data points to, not in the order they are listed here. A business with a healthy funnel but weak reactivation should start at reactivation, even though it is listed last in this guide. The order below is for reference, not a required sequence.
Acquisition: Lead With Qualified Channels, Not Just Volume
Match each channel to its own landing page instead of a shared one. Track conversion rate by channel group, not only traffic by channel. A channel that brings a lot of unqualified visitors should be visible before it drains the rest of the budget.
Review which channels produce customers who stay, not just customers who buy once. A guide to lead generation tactics is a useful next step for picking channels by this standard.
Conversion: Lead With A Checkout Friction Audit
Walk through your own checkout on a phone, start to finish. Note every point of friction: hidden costs that appear late, a forced account step, or a form asking for information the business does not need yet. Fix the most common cause first, since it affects the largest share of abandoning shoppers.
Once checkout friction is addressed, smaller tests on button copy and layout can refine a path that already converts. Reviewing common conversion rate optimization mistakes helps you avoid re-testing the wrong layer of the page.
Offer guest checkout as the default path, not an option a visitor has to search for. Even businesses that eventually want an account can ask for it after the order is placed, once trust is already established by a completed purchase.
Retention: Lead With The Second Purchase, Not Loyalty Points
Treat the second purchase as its own goal. Track it and report it separately from the first sale. A simple, well-timed follow-up after the first purchase, offering something genuinely useful rather than a generic discount, usually outperforms a loyalty programme that customers never notice.
Segment repeat customers from one-time buyers in your reporting. RJMetrics’ data shows the gap between them is large enough that blending the two into one average hides the real retention story.
Reactivation: Lead With A Real Reason, Not Just A Discount
Before sending a win-back email, say something true and specific. Name a new option that solves the reason they likely left, share a real update, or ask a direct question about what happened. Save the discount for a second message, not the first.
Track reactivation as its own funnel: open rate, click rate and the final purchase rate. Open rates are stronger than purchase rates in the published benchmark above, so message content is usually the first thing worth testing.
How Often To Revisit Each Fix
Acquisition and conversion fixes show results fastest, often within two to four weeks, because the data volume is higher. Retention and reactivation fixes take longer to read clearly, since you need a full purchase cycle, or more, to see whether a second sale actually followed the change.
Review acquisition and conversion changes monthly. Review retention and reactivation changes on a cycle that matches your own typical time between purchases, whether that is weeks for a subscription box or months for a big-ticket item.
Write the review date down when you launch a fix, so a slow-moving retention change is not judged against a two-week acquisition timeline by mistake. Mismatched timelines are a common reason teams abandon a retention fix before it had time to show up in the data.
Measuring Customer Lifecycle Marketing Progress
Track one metric per stage, defined the same way every time you report it. A single blended growth number hides which stage needs the work.
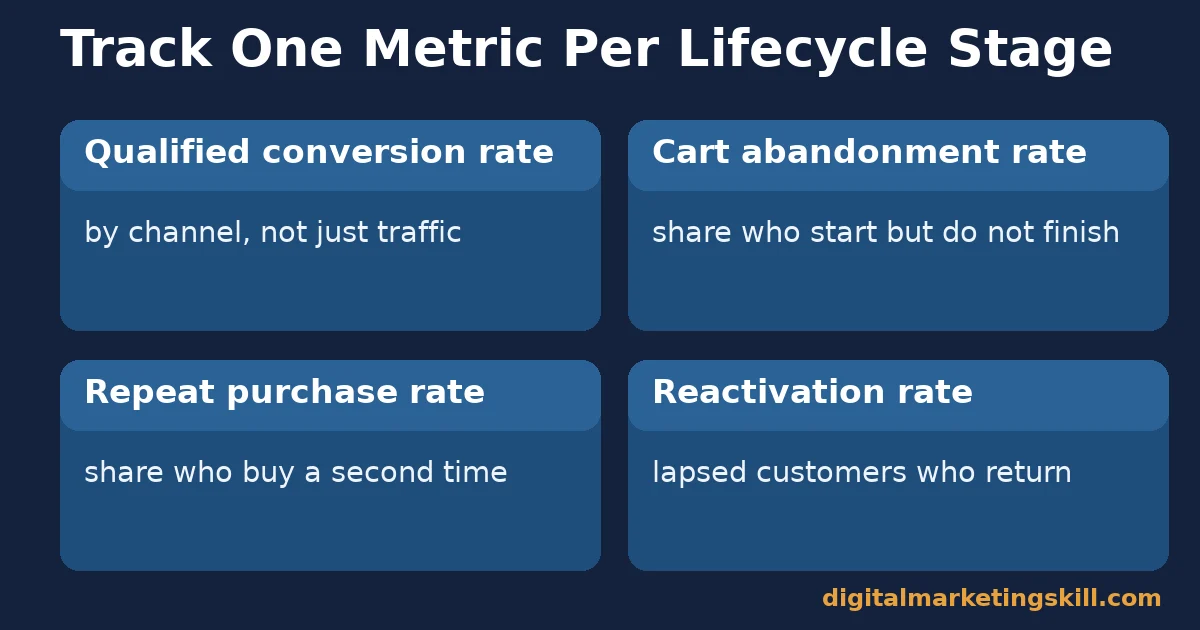
- Qualified conversion rate by channel. The share of visitors from each channel who complete a purchase, not just the share of total traffic that channel sends. A channel with high volume and low conversion is an acquisition problem, not a conversion one.
- Cart or checkout abandonment rate. The share of shoppers who start checkout but do not complete it. Compare this against Baymard’s 70.19% benchmark only as a rough reference point, and track your own trend over time.
- Repeat purchase rate. The share of customers who buy a second time within a set window. This is the clearest single signal of retention health, separate from total revenue.
- Reactivation rate. The share of lapsed customers who make another purchase after a win-back message. Track it alongside open rate, since a message can be opened widely and still fail to convert.
Read these four together, in order. A low qualified conversion rate with healthy traffic points to acquisition. A high abandonment rate with healthy qualified conversion points to checkout. A low repeat purchase rate points to retention. A healthy open rate with a weak reactivation rate points to the win-back message itself, not the audience.
The One Decision Rule: Fix The Stage With The Biggest Revenue Gap First
If you fix only one thing after reading this guide, make it this. Calculate the revenue each stage is losing, in dollars, not just in percentage. Fix the stage with the largest dollar gap first.
Here is an illustrative example, with invented numbers. A store gets 10,000 monthly visitors at a 2% conversion rate and a $50 average order. That produces $10,000 in new-customer revenue. Its repeat purchase rate sits at 15%, well under category norms, while cart abandonment is roughly average for its sector. Lifting the repeat purchase rate by 10 percentage points would add far more monthly revenue than a one-point gain in conversion rate. It compounds against an existing, already-acquired customer base.
The rule is not “retention always wins.” It is “measure the dollar gap at each stage, then fix the largest one first.” The answer depends on your own numbers, not a universal ranking of the four stages.
To calculate the gap at each stage, start with your current monthly revenue from that stage, then estimate what a realistic fix would add. For acquisition, that might be the revenue from switching spend away from a low-converting channel. For conversion, it is the revenue recovered from reducing abandonment by a few points. For retention, it is the revenue from lifting the repeat purchase rate. Compare the four estimates side by side, then start with the largest one.
A Real Case: What RJMetrics Found Across Thousands Of Stores
RJMetrics, an ecommerce analytics company, published a benchmark study analysing transaction data across a large set of online stores. It found that the typical store earns 43% of its revenue from repeat customers. Its top 1% of customers spend about 30 times more than the average customer.
The study also found that roughly half of total revenue, across the stores it analysed, came from just the top 15% of customers. That concentration means a small drop in retention among high-value repeat customers can matter more to revenue than a much larger swing in new-visitor traffic.
The limit of this case matters. It is an aggregate study across many stores, not a single company’s results. Ecommerce categories vary widely in repeat-purchase behaviour. Treat the percentages as a reference point for where to look, not a target every business should expect to hit.
The practical takeaway is still useful outside ecommerce. Whatever the business, a small group of repeat customers usually accounts for a disproportionate share of revenue. Identifying that group, and treating their experience as a priority rather than an afterthought, is a direct application of customer lifecycle marketing even without matching RJMetrics’ exact numbers.
Frequently Asked Questions About Customer Lifecycle Marketing
What is customer lifecycle marketing?
It is the practice of managing acquisition, conversion, retention and reactivation as four separate, measurable stages. Growth is not treated as a single number. Each stage gets its own metric and its own fix.
How do I start customer lifecycle marketing if I only track one number today?
Begin by splitting that one number into its four underlying stages for a single month. Even a rough first pass, using whatever data your analytics or checkout tool already records, usually reveals which stage needs attention before you invest in better tracking.
Which stage of customer lifecycle marketing matters most?
Whichever one is losing the most revenue right now. Calculate the dollar gap at each stage using your own numbers before deciding, since the answer is different for every business. A stage that looks fine on a percentage basis can still be the biggest dollar opportunity once you multiply by your actual customer volume.
Is customer retention really cheaper than acquisition?
The two are measured differently, so a direct cost comparison varies by business. What is well documented is the probability gap. Marketing Metrics puts the chance of selling to an existing customer at 60-70%, against 5-20% for a new prospect.
How do I reduce cart abandonment?
Start with the most common cause: unexpected costs that appear late in checkout. Baymard Institute’s research names this as the top reason shoppers cited for abandoning a cart, ahead of forced account creation and a checkout that feels too long.
Do win-back emails actually work?
They open well but convert modestly. Omnisend’s data shows a 33% open rate against a 0.52% conversion rate for lapsed-purchase emails. The audience is receptive, even if the message usually needs work.
How often should I review customer lifecycle marketing metrics?
Monthly is usually enough to see a real trend rather than normal daily noise. Reviewing more often mostly adds noise, unless you just launched a specific test on one stage.
What is a good repeat purchase rate?
There is no single good number, since it varies by category and price point. RJMetrics’ benchmark study found a typical figure near 43% of revenue from repeat customers. Use that as a reference point, not a universal target.
Can customer lifecycle marketing work for a brand-new business?
Yes, but with less retention and reactivation data to act on at first. Spend the early months building a clean baseline for each stage, so you can spot which one is underperforming once you have enough repeat customers to measure.
Does customer lifecycle marketing apply outside ecommerce?
Yes. The same four stages apply to services, subscriptions and B2B sales, though the metrics change shape. A service business might track signed contracts instead of checkout completion, and renewal rate instead of repeat purchase rate, but the underlying logic of measuring each stage separately still holds.
Build This Skill Into Every Campaign You Run
Customer lifecycle marketing is a skill that compounds across acquisition, conversion, retention and reactivation at once. A team that measures all four stages separately, rather than reporting one blended number, finds its biggest revenue gap faster. It fixes that gap with evidence instead of guesswork.
Digital Marketing Skill Institute teaches this inside the Master Diploma in Digital & AI Marketing, through four AI-powered tracks built from ten courses: AI-Powered Social Media Management and Advertising, AI-Powered Lead Generation and Email Automation, AI-Powered Google Specialist, and AI-Powered WordPress and SEO Specialist, with a Full Stack option for completing all four. Every track includes unlimited 1-on-1 coaching and mentoring, plus a U.S. Project Internship with a verified U.S. work reference letter.
The Master Diploma is dual US and UK accredited and recognised in more than 100 countries. It runs 100% online, so you can build these skills from anywhere in your country. Explore more guides on the Digital Marketing Skill Institute blog, read real outcomes on the reviews page, or when you are ready, apply for the Master Diploma. You can also start from the Digital Marketing Skill Institute homepage, wherever you live.
Every figure in this guide was checked against its original source before publication. Figures marked as illustrative are invented examples, not real results.
![9 Amazing Digital Marketing Skills to Make Money Online [With Proof]](https://digitalmarketingskill.com/wp-content/uploads/2019/07/9-Amazing-Digital-Marketing-Skills-to-Make-Money-Online-With-Proof-17.png)






