
Conversion rate optimization mistakes are rarely about bad tools. They come from testing the wrong thing, testing without a question, or stopping before the data is real. This guide names six of the costliest errors. It gives the fix for each one, plus the one rule that decides what to test first.
Key Takeaways
- Most tests do not win. ConversionTeam’s audit of 2,288 tests found a 50.5% raw win rate. Only 19.1% reached statistical significance, so a raw win is not proof.
- Structure beats inspiration. Econsultancy and Red Eye surveyed more than 450 companies. They found 63% had no structured approach to optimization at all.
- Few users reveal most problems. Nielsen Norman Group’s model shows one visitor uncovers about 31% of usability problems. Three uncover about 65%, and five uncover about 85%.
- Returning visitors convert far better. ConversionTeam’s benchmark set shows a 7.4% median conversion rate for returning visitors against 4.2% for new ones, roughly 1.8 times higher.
- Small cuts move big numbers. Clearbit’s published case on Gong shows cutting a signup form to a single field lifted demo-request conversions by 70%.
In this guide
- The Testing Gap Behind Most Optimization Programs
- How Conversion Rate Optimization Actually Works
- Six Conversion Rate Optimization Mistakes, By Type
- How to Fix Conversion Rate Optimization Mistakes, One by One
- Single-Element Testing: Lead With the Full Journey
- Testing Without Visitor Intent: Lead With Research First
- Stopping Tests Early: Lead With a Pre-Set Sample Size
- Treating Every Visitor The Same: Lead With Segments
- Trusting Dirty Tracking Data: Lead With A Pre-Launch Audit
- Testing Whatever Is Loudest: Lead With A Scoring Method
- Measuring Progress After Fixing Conversion Rate Optimization Mistakes
- The One Decision Rule for Prioritizing Conversion Rate Optimization Mistakes
- A Real Case: Cutting a Form to One Field
- Frequently Asked Questions About Conversion Rate Optimization Mistakes
- Turn Fixes Into a Repeatable Skill
The Testing Gap Behind Most Optimization Programs
Here is the gap this guide closes. Teams run conversion rate optimization tests. They see a lift, ship the winner, and still do not grow faster. The programme looks active. Yet the result line barely moves.
The cause is rarely a lack of testing. Econsultancy and Red Eye’s survey of more than 450 companies found that 63% had no structured approach to optimization. Tests ran, but nothing tied them to a repeatable process. Activity was mistaken for a system.
Ground rules before you read further. Every figure here is attributed to the company or lab that measured it, along with its sample size. A benchmark from one audit is a snapshot, not a universal law. Treat the decision rule later in this guide as an informed starting point, not a fixed formula for every business.
How Conversion Rate Optimization Actually Works
Conversion rate optimization is the practice of raising the share of visitors who complete a goal, such as a purchase, a signup or a form submission, without raising the amount of traffic you buy. It works in three steps. First, you form a hypothesis about why visitors leave. Then you test a change against a control group. Finally, you measure whether the difference is larger than chance would produce.
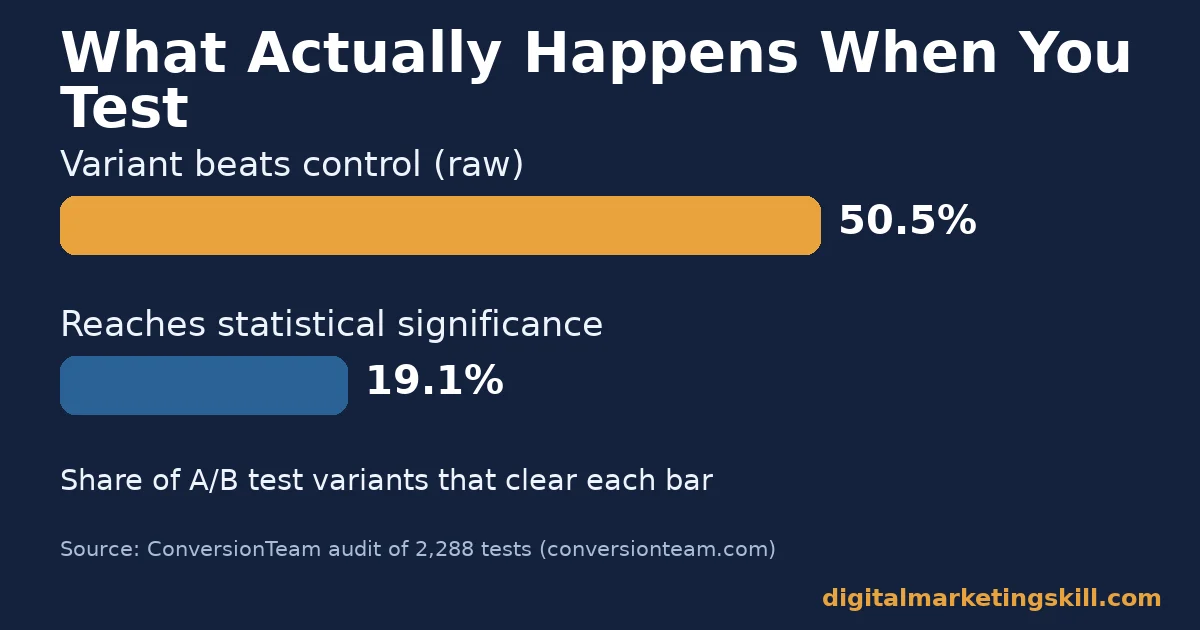
That last step is where most programmes break down. A test needs enough visitors and enough time to separate a real effect from noise. ConversionTeam’s audit of 2,288 client tests found a 50.5% raw win rate. That means just over half of all variants beat the control on the surface. Only 19.1% of tests reached statistical significance. The rest showed no real difference, or were called too early.
The baseline conversion rate also varies more than most teams expect. Across 1,055 audited tests, the same data set found a median baseline of 4.6%. The range ran from about 1.5% for software subscriptions to 6.8% for consumer brands. A result that looks strong for one business model can be ordinary for another. Compare your own rate against your own history before you compare it to an industry number.
This matters for conversion rate optimization mistakes because teams often chase an industry average instead of their own trend line. A site moving from 1.8% to 2.3% has grown by more than a quarter, even if 2.3% still looks low next to someone else’s number.
Six Conversion Rate Optimization Mistakes, By Type
Most conversion rate optimization mistakes fall into one of three patterns, each with three variations below. Each pattern has a mirror-image fix later in this guide. Recognising the pattern is the first step to stopping it.
Single-Element Testing: Built For Small Wins
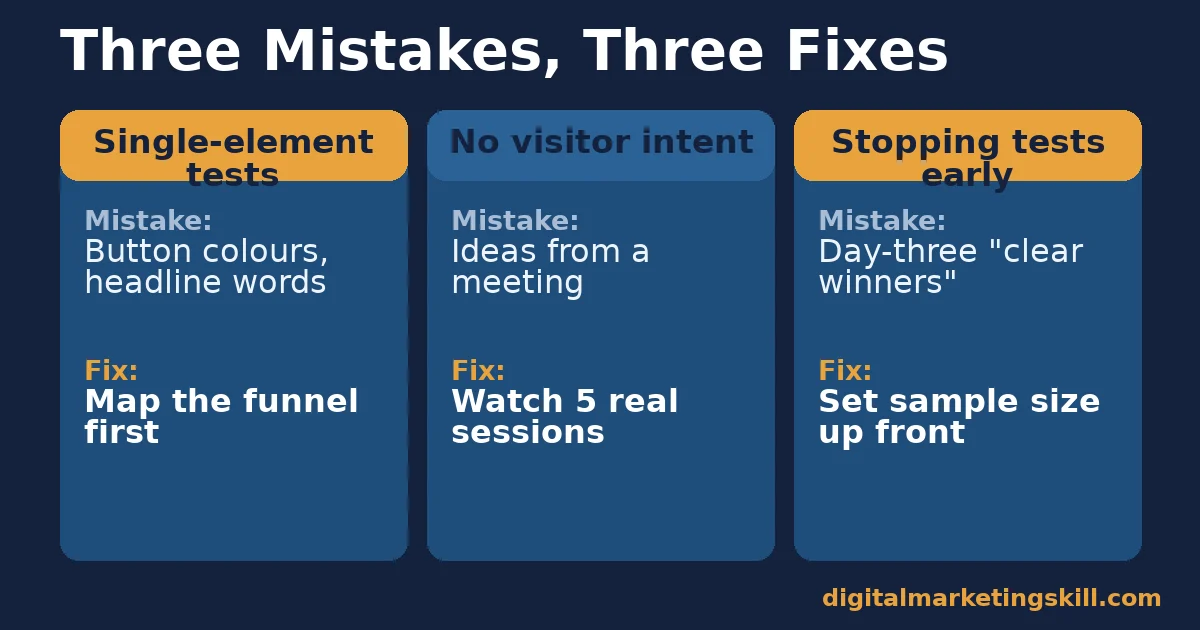
Teams often test a button colour, a headline word or a single icon in isolation. These micro-tests are easy to run and easy to explain in a meeting. So they get repeated long after they stop producing useful lifts.
The deeper problem is scope. A button colour cannot fix a page that answers the wrong question. It also cannot fix a funnel that loses visitors three steps earlier. Testing only the visible layer leaves the real leak untouched. Teams end up mistaking a slightly better landing page for growth.
Testing Without Visitor Intent: Built On Guesswork
A second pattern is testing ideas pulled from a meeting rather than from visitor behaviour. Someone suggests a change. It sounds reasonable, so it becomes the next test. No one asks what the visitor on that page is actually trying to do, or checks whether the page’s own bounce rate already points to the real problem.
Without that question, a test can “win” by accident and still not matter. A page that confuses visitors about price, shipping or next steps will not be fixed by random tweaks. The test was never aimed at the actual point of confusion in the first place.
Stopping Tests Early: Built On False Signals
The third pattern is checking results daily and stopping as soon as a variant looks ahead. That habit inflates false positives. Early leads in a test regularly reverse once enough traffic has passed through both versions.
Programmes that stop early build a stack of “wins” that cannot be reproduced. Confidence grows while the underlying evidence does not. Eventually, a quarter of flat results exposes the pattern, and trust in the whole programme drops with it.
Treating Every Visitor The Same: Built On One Average
A fourth pattern blends desktop and mobile visitors, new and returning visitors, and every traffic source into a single result. The average can hide two opposite effects that cancel each other out.
A change that helps mobile shoppers and quietly hurts desktop shoppers can report as “no difference” overall. The team concludes the idea failed, when in fact half of it worked and the other half needs a separate fix.
Trusting Dirty Tracking Data: Built On An Unchecked Tool
A fifth pattern treats the analytics or testing tool as always correct. No one checks whether the traffic actually split close to the intended ratio, or whether the goal event fires correctly on every device.
A tracking bug can quietly favour one variant for weeks. Teams then act on a result that was never measuring what they thought it was measuring, and the real cause takes far longer to find once decisions have already been made on top of it.
Testing Whatever Is Loudest: Built On Opinion
A sixth pattern lets the most senior voice in the room decide what gets tested next. Ideas compete on confidence rather than on evidence or potential impact.
Without a scoring method, a small cosmetic request can jump ahead of a high-traffic page with a known, measurable drop-off. The testing queue fills with opinions instead of the mistakes most worth fixing first.
How to Fix Conversion Rate Optimization Mistakes, One by One
Each mistake above has a specific fix, matched to the same order. None of these fixes require new tools. They only require a change in what gets tested and when a result counts.
Single-Element Testing: Lead With the Full Journey
Before testing a single element, map the full path from the entry page to the completed goal. Note where the largest share of visitors drops off. Put the first test on that step, not on the easiest one to change.
Once the biggest leak is addressed, smaller tests on copy and layout earn their place. They are refining a path that already works, rather than polishing one that does not. A guide to landing page design that converts is a useful next step once the funnel-level fix is in place.
Testing Without Visitor Intent: Lead With Research First
Before writing a test hypothesis, gather direct evidence. Session recordings, on-page surveys and support tickets that mention the page all count. Nielsen Norman Group’s research found that testing with five users surfaces about 85% of usability problems in a design. Even a small round of observation outperforms guesswork.
Write the hypothesis as a single sentence that names the visitor problem, the proposed fix, and the expected result. If a test cannot be stated that way, it is not ready to run. Reviewing Google Analytics reports for the page’s exit rate and traffic source is a fast way to confirm the problem is real before you test a fix for it.
Stopping Tests Early: Lead With a Pre-Set Sample Size
Fix the stopping problem before the test starts, not during it. Use a sample size calculator to work out how many visitors each variant needs, based on the page’s current conversion rate. Commit to running the test until that number is reached, even if an early lead appears.
Write the sample size and the planned run time down before launch, somewhere the whole team can see it. That single step removes the temptation to call a test early because a variant is “clearly winning” at day three. It also makes test results easier to feed into lead generation tactics that depend on a reliably higher conversion rate, not a lucky week.
Treating Every Visitor The Same: Lead With Segments
Before trusting an overall result, split it by device and by new versus returning visitors. A flat average can still hide a real win for one segment and a real loss for another.
Once a segment-level pattern shows up, decide whether to ship the change for that segment only, or to build a second version aimed at the segment the first change hurt. Either choice beats shipping an average that satisfies no one.
Trusting Dirty Tracking Data: Lead With A Pre-Launch Audit
Before any test goes live, check that the traffic split matches what you configured and that the goal event fires the same way on every device and browser you support. A five-minute manual walk-through catches most tracking bugs before they cost a month of data.
Re-run the same check partway through the test, not only at the start. A plugin update or a site change mid-test can silently break tracking on one variant without anyone noticing until the numbers look strange.
Testing Whatever Is Loudest: Lead With A Scoring Method
Score every test idea on three simple factors: how much traffic the page gets, how large the problem looks in the data, and how easy the fix is to build. Rank ideas by that score instead of by who suggested them.
Revisit the ranked list every few weeks, since new data can move a low-scoring idea to the top. A written scoring method turns “what should we test next” from a debate into a five-minute lookup.
Measuring Progress After Fixing Conversion Rate Optimization Mistakes
Once the fixes for these conversion rate optimization mistakes are in place, track a small set of metrics. They show whether the programme is improving, not just busy. Each one is defined here in a single sentence.
Four Metrics That Separate Signal From Noise
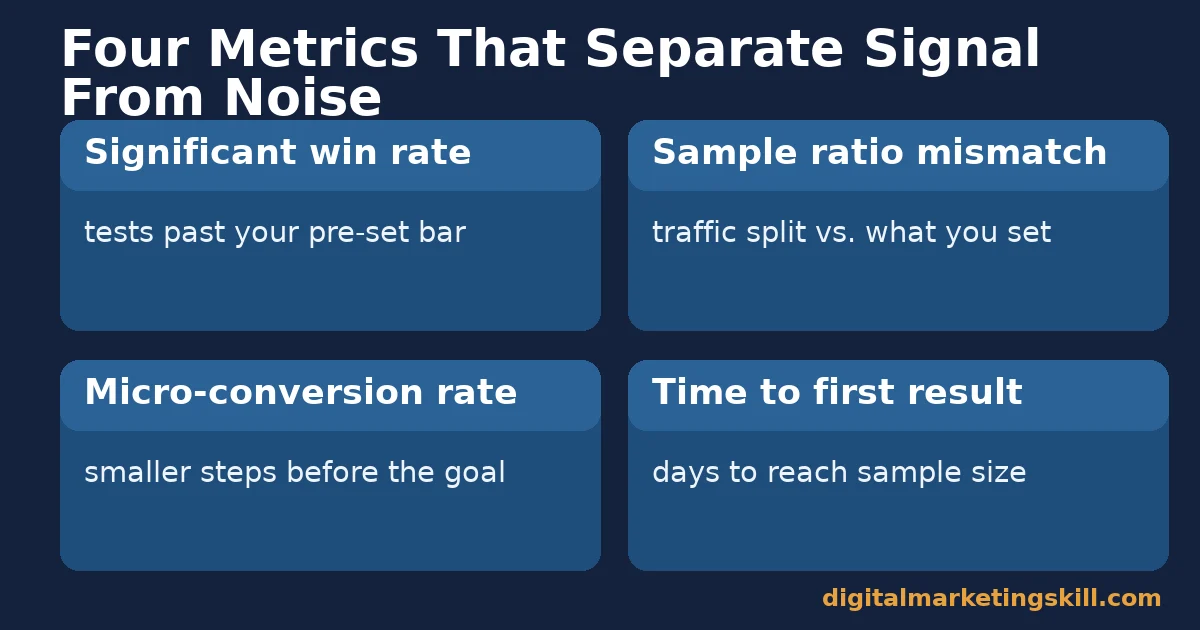
- Statistically significant win rate. The share of tests that cross the significance threshold you set in advance, not the share that simply look ahead at any point. Track this instead of raw win rate.
- Sample ratio mismatch. The gap between the traffic split you intended, for example 50/50, and the split your tool actually recorded. A large mismatch usually means a tracking bug, and it can invalidate an otherwise clean result.
- Micro-conversion rate. The rate at which visitors complete a smaller step before the main goal, such as adding an item to a cart. Rising micro-conversions with a flat final rate point to a problem later in the funnel, not earlier.
- Time to first reliable result. How long, on average, a test takes to reach the pre-set sample size. A programme that tracks this can plan its testing calendar instead of guessing when a result will be ready.
Read these four together. A rising significant win rate with a stable sample ratio mismatch means the programme’s fixes are holding. A rising micro-conversion rate with a flat main goal is a sign to move testing further down the funnel. Neither number means much alone; the pattern across all four is what tells you where to look next.
The One Decision Rule for Prioritizing Conversion Rate Optimization Mistakes
If you fix only one thing after reading this guide, make it this. Fix the step with the largest percentage drop-off before testing any single element on a page that step feeds into.
Here is an illustrative example, with invented numbers. A page funnel loses 40% of visitors between the product page and cart. It loses another 10% between cart and checkout. A team spends a month testing checkout button colours and shipping-cost wording. That work lifts checkout completion by a modest 3%. Because checkout was never the biggest leak, the overall funnel conversion rate barely moves. Redirecting that same month to the product-to-cart step, where the drop is four times larger, has far more room to produce a meaningful lift.
The rule is not “always fix the top of the funnel.” It is “fix the largest leak first,” and that leak could sit anywhere in the journey. Measuring drop-off by step, before you choose a test, is what separates this rule from guesswork. The same leak can also sit after the sale: see customer lifecycle marketing for how to measure retention and reactivation the same way.
A Real Case: Cutting a Form to One Field
A published case study describes how the sales software company Gong reduced its demo-request form from several fields to a single field: a work email address. The remaining information Gong needed for lead qualification was filled in automatically, using Clearbit’s data-enrichment service running behind the scenes.
According to Clearbit’s write-up, the change produced a 70% lift in demo-request form conversions. It also produced a fivefold increase in the number of demo requests received. The underlying mistake being fixed was simple: a form that asked visitors to do work the business could do for them automatically.
The limit of this case matters, since not every form change belongs on a list of conversion rate optimization mistakes to copy blindly. The lift here came from pairing fewer fields with automatic enrichment, not from deleting fields alone. CXL’s own testing has found that removing fields without replacing the lost information can backfire. Treat the case as a working example of the fix, not a guarantee that any form of any length will produce the same percentage gain.
Frequently Asked Questions About Conversion Rate Optimization Mistakes
What is the most common conversion rate optimization mistake?
Testing a single, visible element, such as a button colour, before identifying where visitors actually drop out of the funnel. It produces small, hard-to-repeat wins while the larger leak stays open.
How long should an A/B test run before I trust the result?
Until it reaches the sample size calculated from your page’s current conversion rate and traffic, set before the test starts. Stopping once a variant looks ahead is one of the most common conversion rate optimization mistakes, because early leads often reverse.
Do I need a large audience to avoid these conversion rate optimization mistakes?
No. Nielsen Norman Group’s research shows that observing as few as five real visitors or users surfaces most usability problems. That is often enough evidence to write a focused hypothesis before any traffic-heavy test.
Why did my test show a win that disappeared later?
This usually means the test was stopped before reaching statistical significance, or the sample ratio between variants was mismatched. Both are common conversion rate optimization mistakes that make a result look real when it is not.
Should I test the whole page or one element at a time?
Start by mapping the funnel and finding the step with the largest drop-off. Test that step broadly first, then narrow to single elements once the bigger leak is fixed.
What is a good conversion rate to aim for?
There is no single good number. ConversionTeam’s benchmark data shows a median baseline near 4.6%, but the range runs from about 1.5% to 6.8% depending on the business model. Compare your rate against your own history first.
Can a winning test still be one of these conversion rate optimization mistakes?
Yes. A raw win is only proof once it reaches statistical significance at your pre-set sample size. ConversionTeam’s audit found that just 19.1% of tests cleared that bar, so a lift on day two is not yet a result.
What should I test first on a brand-new site with little traffic?
Skip traffic-heavy A/B tests at first. Use session recordings and short user observations instead, since five users can surface most usability problems. Save split testing for the pages that already get enough visitors to reach significance in a reasonable time.
Turn Fixes Into a Repeatable Skill
Spotting and fixing conversion rate optimization mistakes is a skill that compounds. A team that avoids these conversion rate optimization mistakes, maps funnels, sets sample sizes in advance, and tests the biggest leak first gets more useful data from the same traffic every month. Building that skill properly, rather than picking it up test by test, is faster with structured guidance.
Digital Marketing Skill Institute teaches this inside the Master Diploma in Digital & AI Marketing, through four AI-powered tracks built from ten courses: AI-Powered Social Media Management and Advertising, AI-Powered Lead Generation and Email Automation, AI-Powered Google Specialist, and AI-Powered WordPress and SEO Specialist, with a Full Stack option for completing all four. Every track includes unlimited 1-on-1 coaching and mentoring, plus a U.S. Project Internship with a verified U.S. work reference letter.
The Master Diploma is dual US and UK accredited and recognised in more than 100 countries. It runs 100% online, so you can study from anywhere in your country. Explore more guides on the Digital Marketing Skill Institute blog, read real outcomes on the reviews page, or when you are ready, apply for the Master Diploma and start building this skill from your next test, wherever you live. You can also start from the Digital Marketing Skill Institute homepage to see the full programme.
Every figure in this guide was checked against its original source before publication. Figures marked as illustrative are invented examples, not real results.
![9 Amazing Digital Marketing Skills to Make Money Online [With Proof]](https://digitalmarketingskill.com/wp-content/uploads/2019/07/9-Amazing-Digital-Marketing-Skills-to-Make-Money-Online-With-Proof-17.png)






