
Data-driven marketing decisions beat guesswork, but only when the data is read correctly. Most “use data” advice stops at pulling a dashboard, not at deciding what the numbers actually mean. This guide covers the real chain from a number to a decision. It also covers the KPIs worth tracking, and one rule for knowing when you have enough evidence to act.
Key Takeaways
- Data-driven marketing decisions need three links in a chain: a reliable metric, a meaningful benchmark, and a clear action threshold. Most teams only have the first one.
- Booking.com runs about 25,000 experiments a year, according to Harvard Business Review, and treats every change as a hypothesis to test, not a certainty to assume.
- Nielsen Norman Group’s own research shows testing with just 5 users uncovers roughly 85% of usability problems, proof that small, well-designed samples can still be reliable.
- Optimizely’s own methodology recommends running a test for at least one full business cycle (7 days) before trusting the result, since shorter windows distort weekday and weekend behaviour.
- Quantitative data answers “how many” and “how much”; qualitative data answers “why.” Data-driven marketing decisions usually need both, not just one.
In this guide
- The Real Gap In Most “Use Data” Advice
- How A Number Actually Becomes A Decision
- What Actually Differs Between Data Types
- How To Lead With Each Data Type
- The Three Terms That Separate Signal From Noise
- One Decision Rule For Acting On Data
- A Published Case: What Constant Testing Looks Like
- Frequently Asked Questions About Data-Driven Marketing Decisions
- Turning Numbers Into Data-Driven Marketing Decisions
The Real Gap In Most “Use Data” Advice
Most marketing advice says to “let the data decide.” It rarely explains how. Pulling up a dashboard is not the same as making a decision from it. Dashboards show numbers. Decisions need judgement applied to those numbers, and that judgement is exactly the part most guides skip.
A number on its own means almost nothing. A 2% conversion rate could be excellent or terrible. It depends on the industry, the traffic source, and what changed last month.
This guide is an informed framework. It is not a guarantee of any specific result, and nothing here is financial advice. Every figure is named to its source. None is tied to a specific year, since benchmarks shift as platforms and audiences change.
Worth noting too: the data problem is not new, and CMO Council and similar industry bodies have published statistics-driven marketing guidance for years. Most of those numbers age quickly, since platforms, audiences and algorithms all shift. The framework in this guide is built to outlast any single statistic, because it describes how to evaluate a number, not which number to trust this month.
A useful comparison comes from survey research. SurveyMonkey’s own explanation of margin of error shows that a sample of 600 people, at a 95% confidence level, can still carry a margin of error around 4 percentage points. Marketing dashboards carry the same kind of uncertainty, even when nobody labels it on the screen.
How A Number Actually Becomes A Decision
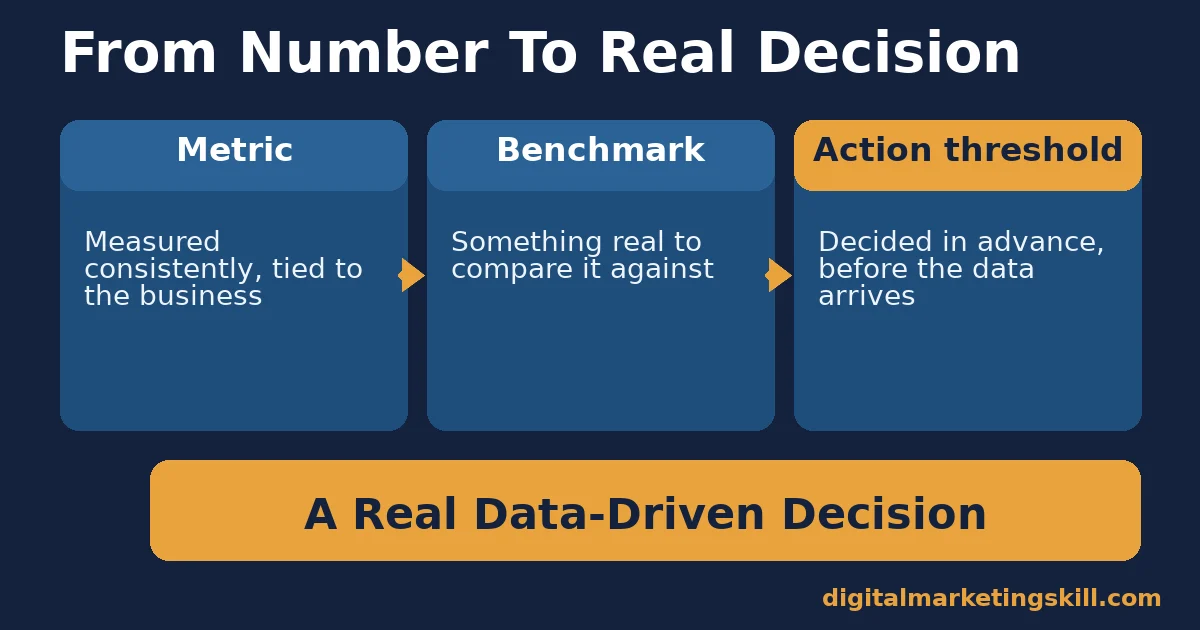
Three links connect a raw number to a real decision. Break any one of them, and the decision is really just a guess wearing a dashboard. Walking through all three, deliberately, takes a few extra minutes. It is the difference between a decision you can defend and one you can only hope was right.
The Three-Link Chain
Think of it as a simple test for any claim: can you name the exact metric, the exact benchmark it beat, and the exact threshold that made you act? If any answer is vague, the decision behind it was probably vague too.
First, a reliable metric. The number has to be measured consistently. It also has to be tied to something that actually matters to the business, not just something easy to track. Google Analytics’ own documentation calls this a “key event”: an action that is particularly important to the business, chosen deliberately, rather than every action the tool happens to collect by default.
Second, a meaningful benchmark. A number needs something to compare against: last month, a control group, or an industry reference point. Without a benchmark, you cannot tell good from bad. A 3% conversion rate sounds low in isolation. Next to a previous month of 2%, it is a genuine improvement worth understanding and repeating.
Third, a clear action threshold. Decide in advance what result would actually change your behaviour. Write the threshold down somewhere visible, before the data comes in, not after. Many teams skip this step. They simply look at results after the fact, then build a story to justify whatever happened. This habit has a name: it is called HARKing, hypothesizing after the results are known, and it quietly turns every result into a win, even a random one.
What Actually Differs Between Data Types
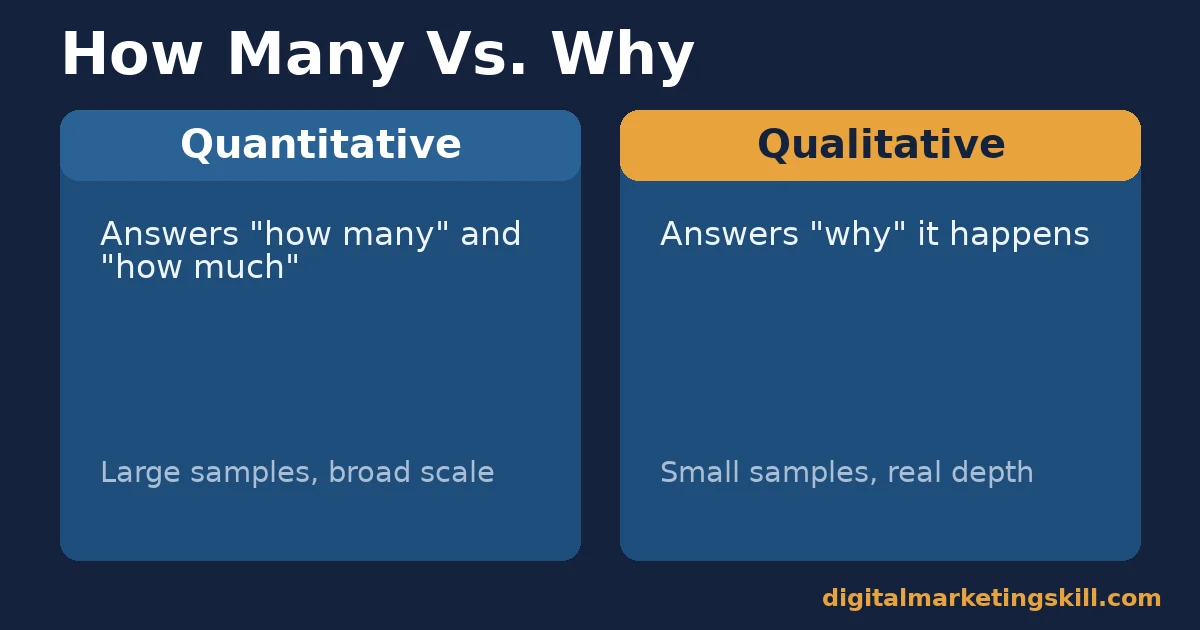
Two broad categories of data sit at opposite ends of one spectrum. One tells you what is happening, at scale. The other tells you why it is happening, in depth. Data-driven marketing decisions usually need both.
Quantitative Data: Built For Scale
Quantitative data counts things: clicks, conversions, revenue, time on page. It comes from large samples, so it is good at answering “how many” and “how much” with confidence. Google Analytics, ad platform dashboards and sales data are the usual sources.
The limit is that quantitative data rarely explains motive. A drop in conversion rate shows that something changed. It does not show what the visitor was thinking when they left. You can watch the number fall for weeks without ever learning the reason, unless you bring in a second kind of evidence.
Qualitative Data: Built For Why
Session recordings, support tickets and open-ended survey answers all count as qualitative sources too, not just formal interviews. Any of these can surface a pattern that a dashboard full of numbers would never show on its own.
Qualitative data comes from a small number of people, studied closely: user interviews, session recordings, open-ended survey answers, usability tests. Nielsen Norman Group’s own research found that testing with just 5 users surfaces around 85% of usability problems, because early users repeat most of the same issues.
The trade-off is scale. Five interviews cannot tell you what percentage of all visitors share an opinion. They can tell you, in detail, why a specific group behaves the way it does, which quantitative data alone cannot do. The two methods are not competitors. They answer different questions, and treating them as rivals is one of the quieter reasons data-driven marketing decisions go wrong.
Mixed Methods: Built To Close The Loop
A third approach combines both, in sequence. Spot a problem in quantitative data first, such as a conversion drop on one page. Then run a small qualitative study, such as five user interviews, aimed only at that specific page and that specific drop.
This closes the loop that either method alone leaves open. The quantitative data tells you where to look. The qualitative data tells you what you will find once you get there. Running both together, in that order, is usually faster than guessing at a fix and testing it blind.
How To Lead With Each Data Type
Choosing where to start mirrors the gap above. Match the data type to the question you are actually trying to answer.
Quantitative Data: Lead With A Big Enough Sample
Write down your action threshold before the test starts, not after you see the result. Decide now what lift, in what metric, would actually justify shipping the change. This single habit prevents most of the bad data-driven marketing decisions covered in this guide. It removes the temptation to reinterpret a weak result as a win after the fact.
Before trusting a quantitative result, check two things: sample size and test duration. Optimizely’s own guidance recommends running a test for at least one full business cycle, typically seven days, so weekday and weekend behaviour both get represented. A result from two days of traffic is not yet a result; it is an early signal.
Qualitative Data: Lead With A Small, Focused Sample
Do not wait for a large budget to run qualitative research. Five focused interviews or usability sessions, run around one specific question, beat a vague survey sent to thousands. Run a small round, fix what you learn, then run another small round. Three rounds of five beats one round of fifteen, because you get to act on what you learn between each one.
Write your five questions down before the first interview, and stay close to them. A loosely structured conversation feels natural. It makes comparing answers across participants far harder, though, which weakens the very data-driven marketing decisions you are trying to make.
The Three Terms That Separate Signal From Noise
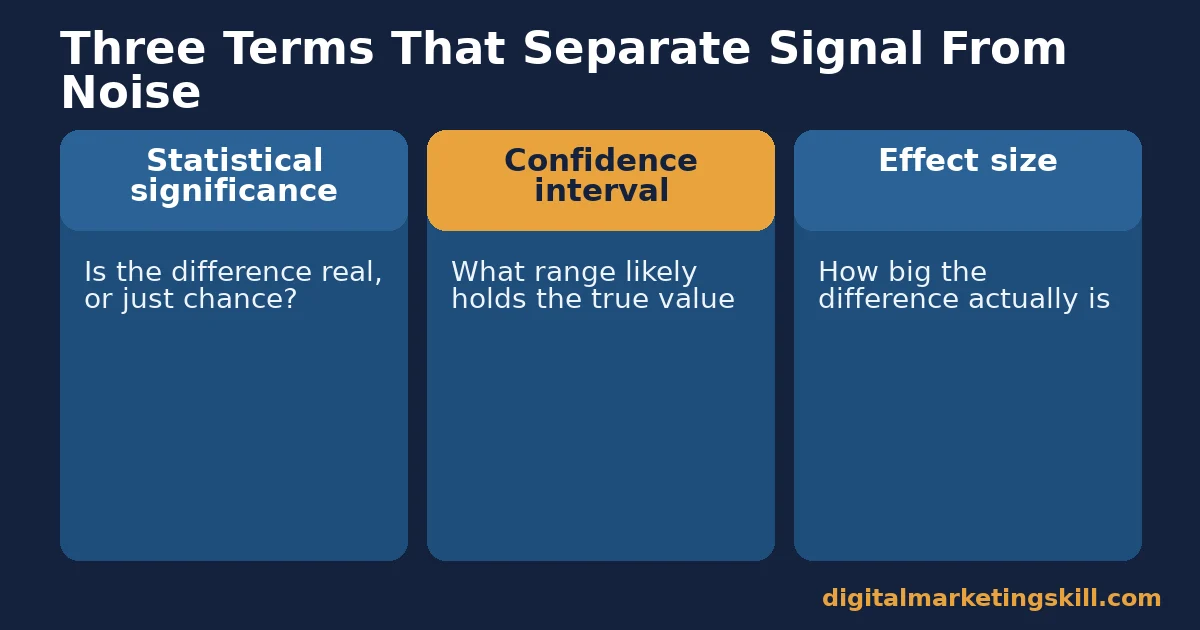
Teams that misread data usually skip one of three statistical basics. Each is defined below in plain terms.
Statistical significance is a measure of whether a difference between two results is real, or just random chance. Optimizely’s own glossary defines it through the p-value: the lower the p-value, the less likely the difference happened by accident.
Confidence interval is the range that likely contains the true value, not just the single number your sample happened to show. A wide confidence interval means your sample was too small or too noisy to trust closely. A narrow one means you can act on the number with far more confidence than a single point estimate ever deserves on its own. Most analytics dashboards show the point estimate only, so this is worth checking separately before you trust what the screen shows you.
Effect size is how big the difference actually is, separate from whether it is statistically significant. A tiny, real difference can still be too small to matter for the business, even if the statistics check out.
All three terms work together. A result can be statistically significant with a tiny effect size, which is real but not worth acting on. A result can have a large effect size but a wide confidence interval, which means it might not be real at all. Data-driven marketing decisions need all three checked together, not just one.
Document The Decision, Not Just The Data
Write down what you decided, why, and what evidence supported it, every time. A short record, even a few sentences, turns a one-off decision into something the next person can learn from. Without this habit, the same debate tends to repeat every few months, with nobody remembering what the last test actually showed.
One Decision Rule For Acting On Data
Here is the rule. Do not act on a quantitative result until it is both statistically significant and large enough in effect size to matter to the business. Do not dismiss a qualitative finding just because it came from a small sample. Check instead whether it repeats across multiple participants.
Illustrative, invented numbers, to show the trade-off. Imagine Test A shows a 0.1% lift in conversion rate, with a p-value of 0.03. By the usual 0.05 threshold, that counts as statistically significant. Now imagine Test B shows a 5% lift, but with a p-value of 0.12. That result is not significant by the same standard.
Test A is technically “real,” but nearly meaningless in revenue terms, since the lift itself is tiny. Test B could be meaningful if it holds up, but it is not yet proven. The correct move here is neither to ship Test A nor ignore Test B. Extend Test B’s sample size first, then decide once the result is either confirmed or disproven.
A Published Case: What Constant Testing Looks Like
Booking.com runs about 25,000 experiments a year, according to Harvard Business Review’s own reporting on the company. Its culture treats almost every product and marketing decision as a hypothesis to test, not an assumption to trust. Changes only ship after they win in a live test against the current version.
The limits matter here. Booking.com operates at a scale most businesses never will. It has enough daily traffic to reach statistical significance quickly on almost any test. A smaller business needs longer test windows and fewer simultaneous tests to reach the same level of confidence. That is not a disadvantage worth apologising for. It is simply the honest trade-off of working with less traffic, and planning around it beats pretending it does not exist.
The principle, not the exact volume, is what transfers. Treat changes as hypotheses. Let a live comparison decide, rather than a confident guess. A team running five tests a year can apply the same mindset as a team running five hundred; only the pace changes.
What makes this approach work at Booking.com’s scale is not cleverness. It is discipline, applied consistently over many years. The same discipline, applied patiently by a much smaller team, produces the same quality of data-driven marketing decisions, just more slowly.
Frequently Asked Questions About Data-Driven Marketing Decisions
How much traffic do I need before I can make data-driven marketing decisions?
There is no single number. It depends on your current conversion rate, and on how big a change you are testing. As a practical rule, if a test has not reached statistical significance after a full business cycle, let it run longer. Do not call it early based on a partial result. A free online sample-size calculator can give you a rough estimate before you launch. This saves you from running a test that was never going to reach significance in a reasonable time.
Is qualitative or quantitative data more important for data-driven marketing decisions?
Neither replaces the other. Quantitative data tells you what is happening and how often; qualitative data tells you why. A conversion drop found in analytics, explained by a handful of user interviews, is a far stronger basis for a decision than either source alone. Teams that pick only one tend to either chase numbers nobody can explain, or collect opinions nobody can verify at scale.
What is the biggest mistake businesses make with marketing data?
Calling a test early, before it reaches statistical significance, is the most common mistake. A close second is tracking metrics that are easy to measure instead of metrics that are actually tied to revenue or retention. Page views and social likes are easy to pull and feel productive to report, but neither reliably predicts revenue on its own.
How do I know if my sample size is big enough?
A confidence interval that is still wide relative to the effect you are measuring is the clearest sign your sample is too small. Our guide to split testing covers practical ways to estimate the sample size a test needs before you launch it. As a rough starting point, most consumer marketing tests need at least a few hundred conversions per variation before the result is worth trusting. The exact number depends heavily on your baseline conversion rate, so treat this as a starting estimate, not a fixed rule.
Do small businesses need the same data rigor as large companies like Booking.com?
The principle is the same; the volume is not. A small business will reach statistical significance more slowly, simply because it has less traffic, so it needs to run fewer simultaneous tests and give each one more time before deciding.
Can data-driven marketing decisions still be wrong?
Yes. Data reduces guesswork; it does not remove risk entirely. A well-run test can still be undone by an outside event, a seasonal shift, or a change on a competitor’s side that nobody accounted for. Treat even a solid result as the best current answer, not a permanent fact. Staying willing to re-test a past decision, when circumstances genuinely change, is itself part of running a properly data-driven marketing process, not a sign that the earlier work was wasted.
How often should I revisit a data-driven marketing decision?
Revisit a decision whenever the context it was made in changes meaningfully: a new traffic source, a pricing change, a shift in who your audience actually is. Outside of those triggers, a quarterly review is a reasonable default for most marketing metrics, frequent enough to catch drift without re-litigating every result constantly.
What tools do I need to start making data-driven marketing decisions?
You do not need an enterprise platform to start. A properly configured analytics tool, such as the setup covered in our Google Analytics for beginners guide, combined with a simple spreadsheet for tracking test results, is enough for most small and mid-sized marketing teams. Add a basic survey tool for qualitative input. With those two pieces, you have everything most businesses need for a full year of testing, well before any paid platform becomes worth the cost.
Turning Numbers Into Data-Driven Marketing Decisions
Making real data-driven marketing decisions is a discipline, not a dashboard. Check the three-link chain, metric, benchmark, action threshold, before trusting any number. Match quantitative data to “how many” questions and qualitative data to “why” questions, and never call a test early. None of this requires expensive tools. It requires a habit, applied the same way every time a number shows up asking to be trusted. Our guides to conversion rate optimisation and marketing analytics go deeper into applying this framework to a live website.
Keep Building The Skills Behind Data-Driven Marketing Decisions
If you want structured, guided training in this instead of piecing it together from guides, the Digital Marketing Skill Institute offers one. Its Master Diploma in Digital & AI Marketing covers ten practical courses, including AI-powered Google Analytics and AI-powered search and content marketing. It includes unlimited 1-on-1 coaching and mentoring, plus a real U.S. project internship from day one, so you practise reading real data, not just theory. Every course is built around real metrics, real benchmarks and real decisions, rather than abstract theory with no live data behind it.
The program is dual accredited in the US and UK, recognised in more than 100 countries, and runs 100% online, so you can build these skills from anywhere in your country. Apply to the Master Diploma program, read more on the Master Diploma page, browse more guides on the blog, or see what graduates say on the reviews page. Wherever you live, Digital Marketing Skill Institute teaches these skills 100% online. Learn more at digitalmarketingskill.com.
Every figure in this guide was checked against its original source before publication. Figures marked as illustrative are invented examples, not real results.
![9 Amazing Digital Marketing Skills to Make Money Online [With Proof]](https://digitalmarketingskill.com/wp-content/uploads/2019/07/9-Amazing-Digital-Marketing-Skills-to-Make-Money-Online-With-Proof-17.png)






