
Average order value is the typical amount a customer spends in one transaction. Find it by dividing total revenue by the number of orders. Lifting it is often cheaper than finding new traffic, because the fix works on people who already decided to buy. A $10 rise across every order compounds fast once it repeats every week.
Key Takeaways
- Stores vary widely. Littledata’s benchmark of 421 Shopify stores puts the median average order value at $110, with the top 10% reaching $643.
- Free shipping changes behaviour. Capital One Shopping’s research found 93% of shoppers add items specifically to qualify for free shipping.
- Most shoppers will spend more to avoid paying for shipping. The same research found 81% of Americans are willing to spend more to clear a free-shipping threshold.
- Keeping customers pays off beyond the next order. Research by Frederick Reichheld, discussed in Harvard Business Review, found that a 5% rise in customer retention raised profits by 25% to 95% in the service businesses studied.
- Cost surprises still break the sale. Baymard Institute’s list of checkout abandonment reasons found 40% of cart abandoners blamed costs that only appeared at checkout, undoing any average order value gained.
In this guide
- What Most Revenue Advice Skips
- What Average Order Value Actually Measures
- Average Order Value Differs By How Customers Buy
- How to Lift Average Order Value For Each Buyer
- How to Measure Average Order Value
- The One Decision Rule: Raise the Floor Before You Chase the Ceiling
- A Real Case: Why Littledata Tracks AOV By Percentile, Not Average
- Frequently Asked Questions About Average Order Value
- Start With Your Own Threshold, Not a Guess
What Most Revenue Advice Skips
Most advice to grow an online store starts with traffic: more ads, more posts, more search rankings. Traffic matters, but it is also the most expensive lever to pull. It does nothing for the customers already on your site right now.
Buying more traffic also has diminishing returns. Each new visitor costs roughly the same to acquire as the last one, no matter how your margins are doing that month. A customer who already added something to their cart costs nothing extra to nudge toward one more item.
That is the core difference this guide keeps coming back to. Acquisition spends money to create a new decision. Average order value spends almost nothing to improve a decision someone already made.
This guide targets that cheaper lever instead. Average order value asks a simpler question: once someone decides to buy, how do you help them buy a little more, without pressure or a fake discount that erodes margin, from the first visit through to a loyal buyer’s tenth order.
A ground rule first: Littledata’s benchmark comes from Shopify stores specifically, so a different platform or a B2B site may sit at a different number entirely. Treat every figure below as a reference point for your own trend, not a fixed target to hit.
The Capital One Shopping and Reichheld figures are broader consumer and services research, not store-specific data. Read them as context for why each lever works, rather than a promise of a specific result on your own site.
What Average Order Value Actually Measures
Average order value is not the same as revenue. It is not the same as how much a customer spends over their lifetime either. Confusing the three leads to the wrong fix. Revenue can rise just because you ran more ads; average order value rises only when each transaction itself gets bigger.
The Formula and Why It Is Easy to Misread
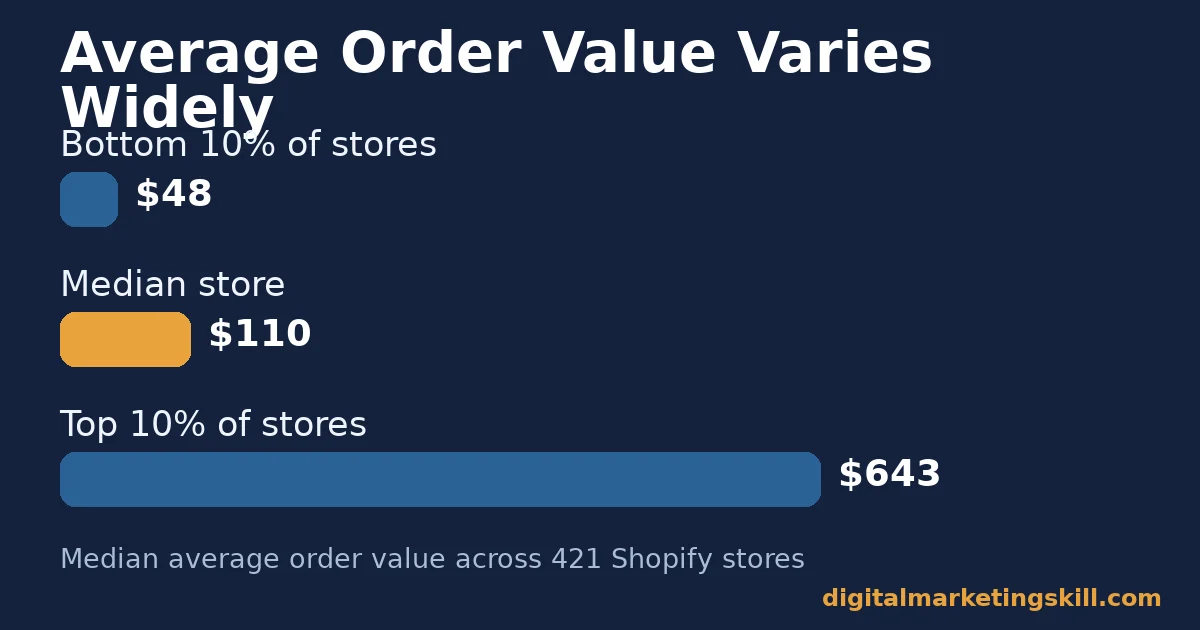
The formula is total revenue divided by number of orders over the same period. A single large order can pull the number up without reflecting what a typical customer actually spent. Littledata’s own benchmark uses the median rather than the average for this reason, since a few unusually large stores can pull a simple average a long way from a typical one.
Littledata’s dataset of 421 Shopify stores, tracked over 90 days, puts the median at $110. The spread is wide: stores in the bottom 10% sit near $48, while the top 10% reach $643. Your own number matters more than where you sit in that spread.
Why This Lever Is Cheaper Than New Traffic
Raising average order value works on people who already clicked “add to cart.” You do not need to win their attention again. You only need to help them see one more relevant item before they pay. That makes it one of the cheapest revenue levers available to a small store.
It also compounds. A small, consistent rise applies to every order from that point on, not just a single campaign. A $5 rise on 200 orders a month is $1,000 of extra monthly revenue, with no extra ad spend behind it.
Fixing checkout friction protects the orders you already have. Raising average order value grows what each of those orders is worth. Neither fix replaces the other, and a store with limited time should usually work on both over a quarter rather than picking just one.
Average Order Value Differs By How Customers Buy
The benchmark above is an average across many kinds of shoppers. In practice, a first purchase and a fifth purchase respond to different nudges. A single tactic will not work equally well on both, and treating every shopper the same wastes the fixes that would work best for each one.
First-Time Buyers: Built On a Single Decision
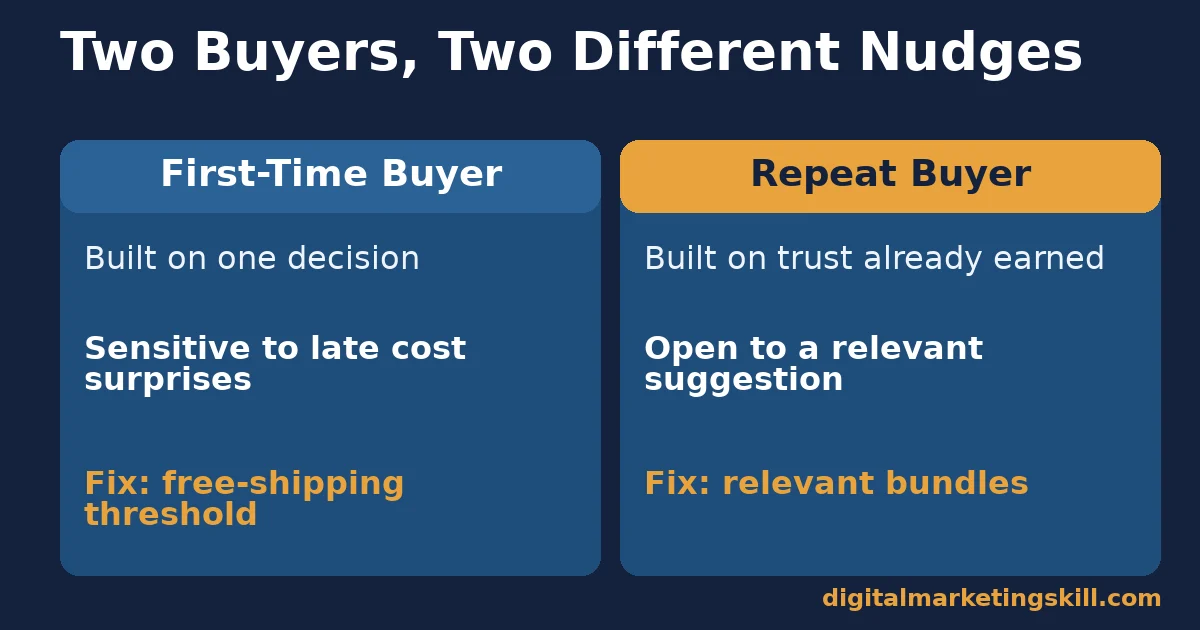
A first-time buyer has no history with your store. They are still deciding whether the brand, the price and the shipping terms feel fair. Every extra cost they discover late in checkout works against that decision. They have nothing to compare your prices against except the last site they visited, so small surprises carry outsized weight.
For this shopper, a visible, achievable free-shipping threshold is the strongest nudge. Capital One Shopping’s research found 93% of consumers shop specifically to qualify for free shipping, most often by adding one more item to the cart.
Repeat Buyers: Built On Trust Already Earned
A repeat buyer already trusts the brand. They are less sensitive to a small shipping fee and more open to a relevant suggestion, because their past orders already worked out. They have evidence, not just a promise, that buying from you turns out well.
For this shopper, Reichheld’s retention research matters more than a shipping threshold. A 5% rise in retention raised profits 25% to 95% in the service businesses his research covered; the underlying point, that a kept customer is worth protecting, holds for an online store’s repeat buyers too.
How to Lift Average Order Value For Each Buyer
The fixes below mirror the two buyer types above. Start with whichever matches most of your orders today, then layer in the other as your store grows.
First-Time Buyers: Lead With a Shipping Threshold
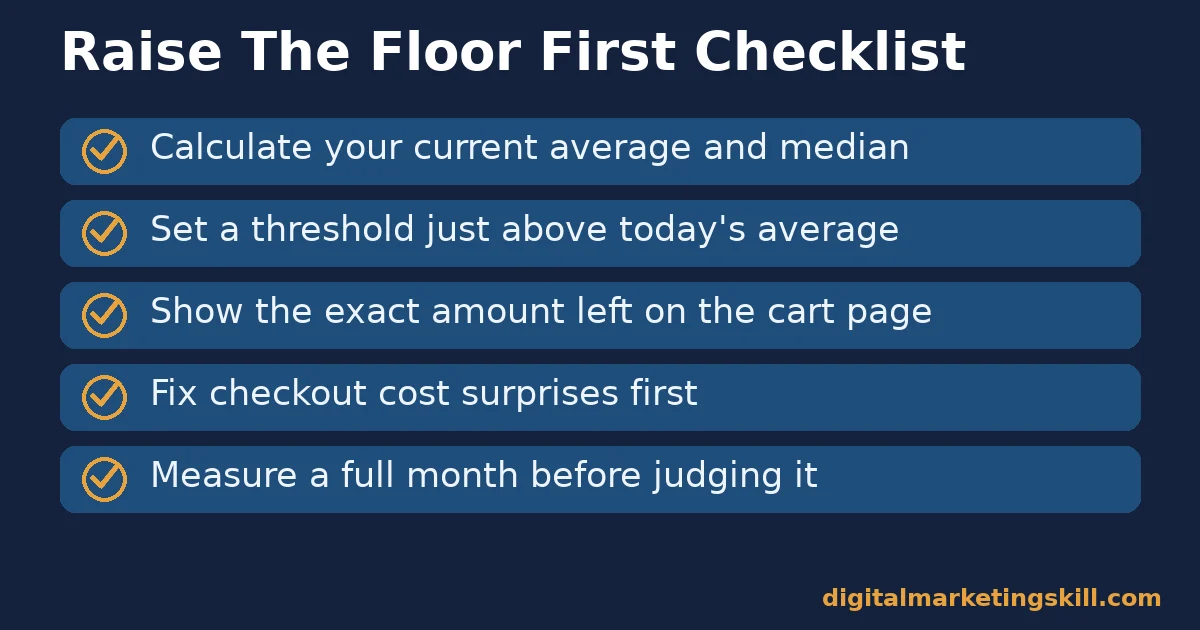
Set a free-shipping threshold slightly above your current average order value, then show the exact amount left to reach it on the cart page. A visible progress indicator gives the shopper a clear, specific reason to add one more item. It turns a vague goal, spend more, into a concrete, achievable one, spend eight more dollars.
- Set the threshold just above today’s average. A target too far out feels pointless; one close by feels achievable.
- Show progress on the cart page. State the exact amount left in plain currency, not a vague percentage.
- Suggest a specific item to close the gap. A generic “add more” prompt converts worse than one named, relevant product.
- Review the threshold quarterly. As your average order value rises, an old threshold stops stretching anyone.
- Watch for abuse of the threshold. If shoppers consistently add a cheap filler item just to qualify, consider whether the threshold or the filler item itself needs adjusting.
Baymard’s research is a useful check here too: 40% of cart abandoners blamed costs that only appeared at checkout. A shipping threshold only helps if the final price still matches what the shopper expected going in. Pairing a higher threshold with a late-appearing fee cancels out the trust you were trying to build, so audit your checkout for surprise costs before you raise the bar.
Repeat Buyers: Lead With Relevant Bundles
Show a small number of genuinely related items, not a wall of unrelated “you might also like” suggestions. Relevance matters more than quantity. A repeat buyer can tell the difference between a thoughtful pairing and a generic widget, and a bad suggestion quietly erodes the trust that got them to return in the first place.
- Pair items that are actually used together. A real-world pairing outperforms an algorithm’s best guess at scale.
- Place the suggestion where attention already is. The product page and the cart page both outperform a page the shopper may never reach.
- Keep the list short. Two or three strong suggestions beat ten weak ones.
- Protect the relationship first. A pushy upsell that annoys a loyal buyer costs more in future orders than it earns today.
- Review which pairings actually sell. Drop a suggestion that never gets added, even if it seemed logical on paper; shopper behaviour is the better judge.
Our guide to customer retention strategies covers the habits that keep a repeat buyer coming back, which is what makes this lever work in the first place. A great bundle still fails if the customer it was aimed at never returns to see it.
How to Measure Average Order Value
Track average order value alongside the numbers you already watch, not as a replacement for them. A rising average order value with falling order count can still mean falling revenue overall. None of these numbers means much read in isolation; each one needs the others for context.
Four Numbers That Show the Real Picture
- Average order value. Total revenue divided by number of orders, over a fixed period such as a month. Google Analytics ecommerce reporting calculates it automatically once purchase tracking is set up. Track the trend over several months, not a single snapshot, since weekly numbers can swing for reasons unrelated to any fix you made.
- Median order value. The middle value when every order is lined up in order, from smallest to largest. It is less skewed by a handful of unusually large orders than the average is, so a big gap between the two is itself worth investigating.
- Orders per customer. How many separate orders a buyer places over time. A rising average order value alongside falling orders per customer may just mean fewer, bigger purchases, not more revenue overall.
- Threshold attainment rate. The share of orders that land at or just above your free-shipping threshold. A cluster of orders just above the line shows the threshold is actually working as intended.
How to Read These Numbers Together
Read average order value and total order count together, not apart. A store can lift its average order value while total revenue falls, if fewer customers are checking out at all.
Watch threshold attainment rate specifically if you just set or changed a free-shipping threshold. A low attainment rate means the threshold is set too high to feel achievable, or it is not visible enough on the page for shoppers to notice. Fix the visibility problem first, since it is the cheaper of the two to test and often the real cause.
The One Decision Rule: Raise the Floor Before You Chase the Ceiling
If you remember one rule from this guide, make it this one: fix the orders sitting just below your free-shipping threshold before you build an elaborate bundling strategy for your best customers. The near-threshold orders are both the easiest group to move and the largest. Most of your orders cluster near your current average by definition.
Here is an illustrative example, with invented numbers. A small home goods store has an average order value of $72 and a free-shipping threshold of $75. Most orders cluster between $60 and $74, just short of the line. The store adds a visible progress bar on the cart page, naming the exact amount left to reach free shipping.
Over the next month, average order value rises to $81, as shoppers who were close to the threshold add one more item to clear it. No new traffic, no discount and no new product were needed. The fix simply made an existing decision easier to complete.
The store also kept its total order count flat while this happened, which matters. If orders had dropped at the same time, the rising average could have hidden falling revenue overall, the exact trap the measurement section above warns about. Checking both numbers together, not just the headline average, is what separated this from a false win.
A Real Case: Why Littledata Tracks AOV By Percentile, Not Average
Littledata built its Shopify benchmark around percentiles, not a single average figure, because a handful of very large stores can pull a simple average far from what a typical store actually sees.
According to Littledata’s own published benchmark, the dataset covers 421 Shopify stores connected to Google Analytics, tracked over a 90-day window, with stores filtered to exclude implausible outliers below $5 or above $5,000 per order. The median sits at $110, with the bottom 10% near $48 and the top 10% at $643.
The limit is worth stating plainly: this benchmark covers Shopify stores with enough traffic and orders to qualify for the dataset, so a brand-new store with few orders is not represented. Treat it as a reference range to compare your own trend against, not a target every store should expect to hit.
A store just starting out should expect its own number to move around more than an established store’s would. Early months carry too few orders to form a stable trend, so wait for a larger sample before reading too much into any one month.
The wide gap between the bottom 10% and the top 10% is itself the lesson. A single average figure would have hidden that gap entirely, making every store look more similar than they actually are. Tracking your own store’s percentile position over time tells you more than comparing a single month’s average to someone else’s.
Frequently Asked Questions About Average Order Value
What is a good average order value?
There is no single good figure, because it varies enormously by industry and price point. Littledata’s Shopify benchmark puts the median at $110, but compare your own trend over time rather than chasing someone else’s number. A store selling $15 accessories and a store selling $400 furniture will never land on the same figure, and should not try to.
How do I calculate average order value?
Divide total revenue by the number of orders over the same period, such as a calendar month. Check the median too, since one unusually large order can pull a simple average higher than what a typical customer actually spent. Most store platforms calculate both automatically in their analytics dashboard.
Does a free-shipping threshold really work?
Evidence points that way. Capital One Shopping’s research found 93% of consumers shop specifically to qualify for free shipping, and 81% say they are willing to spend more to clear the threshold. The effect depends on the threshold feeling achievable, so test more than one amount before settling on a final number.
Should the threshold be the same for every customer?
Start with one threshold set just above your current average order value, then revisit it as that average changes. A threshold set far out of reach does not motivate anyone to add another item. Once you have enough order data, you can experiment with a slightly different threshold by region if shipping costs genuinely differ.
Is raising average order value better than reducing cart abandonment?
They are not competing fixes. Reducing cart abandonment protects orders you would otherwise lose at checkout; raising average order value grows what the orders you keep are worth. Most stores need both, and neither replaces the other.
Do product bundles actually raise average order value?
A relevant, specific pairing shown at the right moment tends to outperform a generic “you might also like” list, though the exact lift depends heavily on the products and the audience. Test your own bundles and measure the change rather than assuming a fixed result. A pairing that works for one category of product can fall flat for another, even within the same store.
Why focus on existing customers instead of new traffic?
Reichheld’s research, discussed in Harvard Business Review, found that a 5% rise in customer retention raised profits by 25% to 95% in the service businesses studied. Average order value and retention both work on people you already have, which is usually cheaper than acquiring new visitors.
How often should I review my average order value?
Monthly is a reasonable rhythm for most small stores, with a closer look whenever you change a shipping threshold, a price or a bundle. Reviewing weekly rarely shows anything new, since order patterns usually need a few weeks to settle before a trend is visible.
Start With Your Own Threshold, Not a Guess
Average order value grows fastest when the fix matches your own numbers, not a borrowed benchmark. Calculate your current average and median. Set a free-shipping threshold just above it, then make the remaining amount visible on your cart page. Give that one change a full month before judging it; a few days of data rarely settles into a reliable trend.
Checkout friction can undo any gain here, so pair this work with our guide to cart abandonment. For the stages before a shopper ever reaches your cart, our guide on finding and fixing a leaking ecommerce sales funnel covers the full picture. Our guide to increasing online sales covers the stages beyond a single order.
If you want guided practice applying fixes like these, Digital Marketing Skill Institute teaches these skills hands-on. The Master Diploma in Digital & AI Marketing includes nine practical courses, among them AI-powered Google Analytics, with unlimited 1-on-1 coaching and real project work inside a U.S. company. It is dual US and UK accredited, recognised in more than 100 countries.
The programme is fully online, so you can study from anywhere in your country. Find more guides on the Digital Marketing Skill Institute blog, and when you are ready, apply for the Master Diploma or start from the Digital Marketing Skill Institute homepage.
Every figure in this guide was checked against its original source before publication. Figures marked as illustrative are invented examples, not real results.
![9 Amazing Digital Marketing Skills to Make Money Online [With Proof]](https://digitalmarketingskill.com/wp-content/uploads/2019/07/9-Amazing-Digital-Marketing-Skills-to-Make-Money-Online-With-Proof-17.png)






