
Conversion rate optimisation fails most often not from bad tests, but from bad beliefs about testing. This guide names seven myths that quietly waste test budget. It shows the reality behind each one, and the one rule that decides whether a result is safe to trust.
Key Takeaways
- The Nielsen Norman Group found that the first 10 seconds of a page visit decide most of whether a visitor stays or leaves. That is why copying a competitor’s layout rarely fixes a weak conversion rate optimisation result on its own.
- Landing pages convert at a median of 6.6% across industries, according to Unbounce’s Conversion Benchmark Report of more than 464 million visitors. The figure ranges from 3.8% in SaaS to 12.3% for events and entertainment.
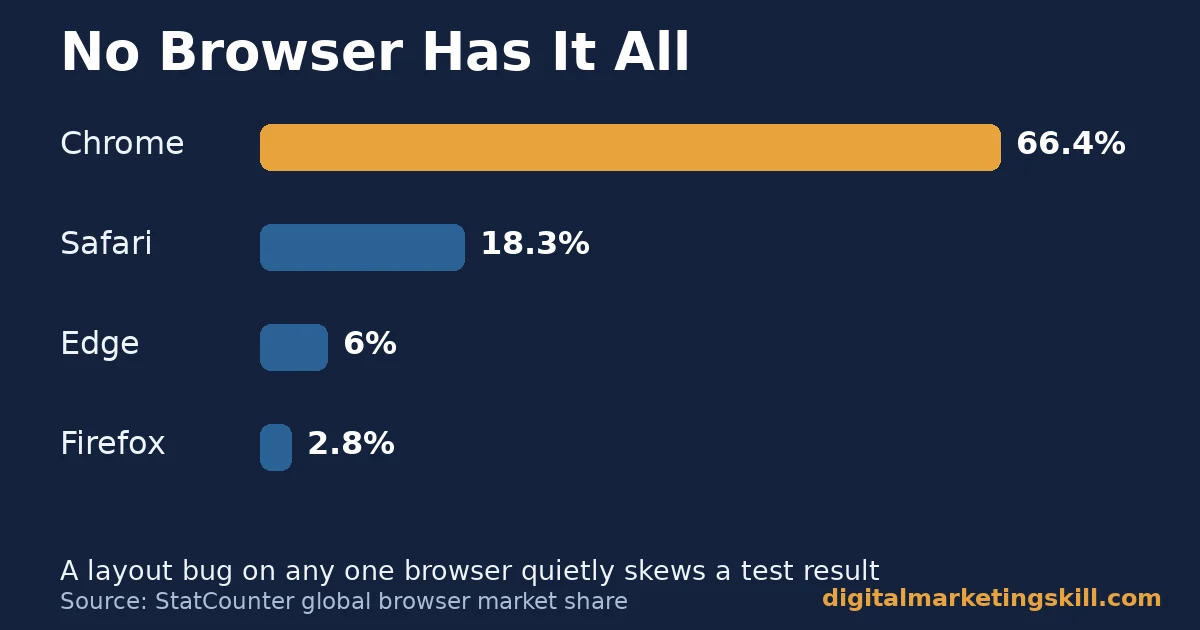
- No single browser controls the market. StatCounter puts Chrome at roughly two-thirds of global browser share, with Safari, Edge, Firefox and others splitting the rest, so a test that only renders correctly in one browser is misreading a share of its visitors.
- Nielsen Norman Group also found that testing with 5 users uncovers about 85% of usability problems, while one user alone finds roughly 31%. Conversion rate optimisation research does not need huge samples to be useful.
- Bain & Company research by Frederick Reichheld found that retaining just 5% more customers can lift profit by close to 100% in service businesses. Optimisation work should not stop at the first conversion.
In this guide
- Why Conversion Rate Optimisation Myths Spread So Easily
- How Conversion Rate Optimisation Actually Works
- What Differs By Myth: The Claim Versus The Reality
- Myth: Copying A Successful Competitor’s Site Will Lift Your Rate
- Myth: A Test Only Needs To Run A Few Days
- Myth: The Testing Tool’s Own Data Is Enough
- Myth: Only The Call-To-Action Button Is Worth Testing
- Myth: Cross-Browser Compatibility Is Not Worth Checking
- Myth: A Winning Test Pays Off Immediately
- Myth: Long Copy Always Hurts Conversion Rate Optimisation
- How To Lead With The Fix For Each Myth
- Copying A Winner: Lead With Your Own Hypothesis
- Short Tests: Lead With A Full Business Cycle
- Tool-Only Data: Lead With Session Behaviour
- CTA-Only Testing: Lead With The Page Around The Button
- Skipping Browsers: Lead With A Spot Check On The Top Three
- Expecting Instant Results: Lead With A Compounding Mindset
- Cutting Copy By Default: Lead With A Relevance Edit
- How To Read Your Conversion Rate Optimisation Results
- The One Decision Rule: Do Not Trust A Result Before Its Full Cycle
- A Real Case: Why Small Samples Mislead Even Careful Teams
- Frequently Asked Questions About Conversion Rate Optimisation
- Turn Conversion Rate Optimisation Into A Repeatable Skill
Why Conversion Rate Optimisation Myths Spread So Easily
Most conversion rate optimisation advice travels as a success story. A company changes a button colour, a headline, or a layout, and conversions rise. The story spreads faster than the context around it.
This guide is an informed framework, not a universal formula. A tactic that worked for one audience, on one page, in one test window, may do nothing for yours. Treat every claim below as a hypothesis to test on your own traffic, not a rule to copy.
Two ground rules keep testing honest. First, a result is only real once it has run long enough, with enough visitors, to rule out chance. Second, a myth usually survives because it is partly true in one narrow case. It then gets generalised far past that case.
A third rule helps too: separate the tactic from the testing discipline behind it. Most conversion rate optimisation failures are not failures of creativity. They are failures of patience, measurement, or both.
How Conversion Rate Optimisation Actually Works
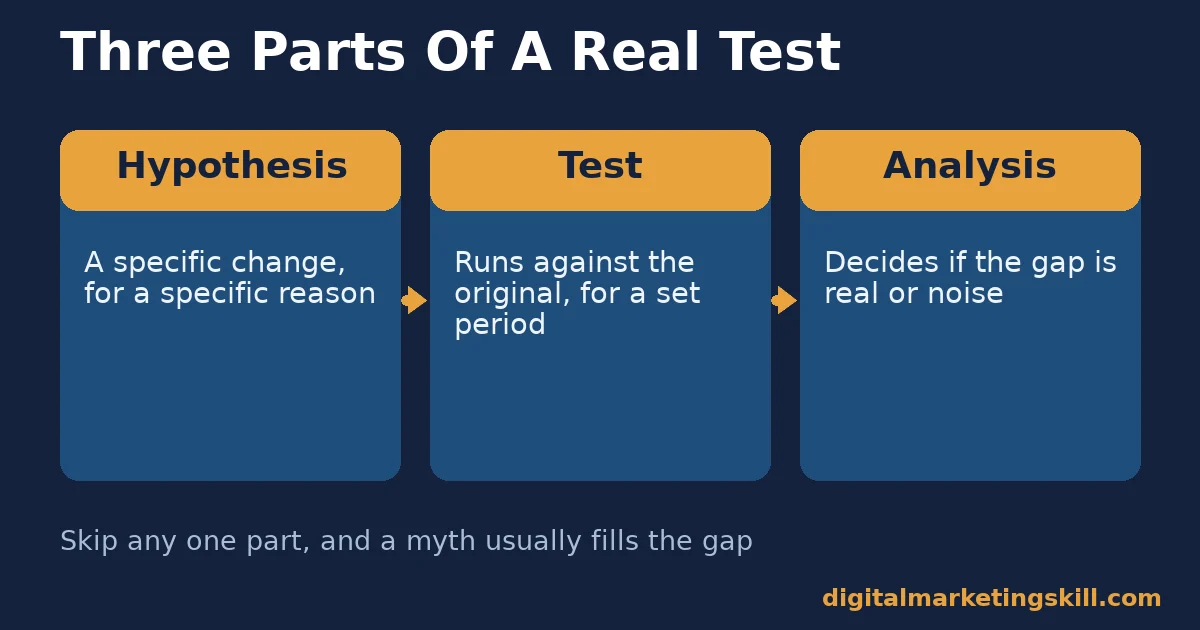
Conversion rate optimisation has three moving parts. A hypothesis proposes a specific change for a specific reason. A test runs that change against the original, for a set period, on a defined audience. Analysis then decides whether the difference is real or just noise.
Skipping any one part is where myths take hold. Change without a hypothesis becomes guesswork. A test without enough duration becomes a coin flip. Analysis without the right data becomes a guess dressed up as a conclusion. For the broader set of skills this sits inside, see our guide to website optimisation skills.
The same button colour that lifted conversions on one site can do nothing, or even hurt, on another. The surrounding page, audience and offer are different every time, so the tactic alone never explains the result.
Google Analytics documents a scroll event that fires the first time a visitor reaches 90% of a page’s height. Pairing that signal with your test tool shows whether a losing variation lost attention early, or lost it only near the end, which points to two very different fixes.
Funnel reports add a second layer. A conversion rate optimisation test often measures only the final step, such as a checkout or a form submit. A funnel view shows every step in between, so a drop that looks like a checkout problem can turn out to be a shipping-cost surprise two steps earlier.
What Differs By Myth: The Claim Versus The Reality
Each myth below states the claim as it is usually repeated. It is followed by the reality that conversion rate optimisation research actually supports.
Myth: Copying A Successful Competitor’s Site Will Lift Your Rate
A case study shows a company changing its button colour or headline and seeing conversions rise. The claim spreads that copying the surface details will repeat the result.
The reality is that the surface change is rarely the real cause. That company likely also changed its offer, audience, or timing alongside the visible test. Case studies almost never report every variable that moved.
Myth: A Test Only Needs To Run A Few Days
Early movement in a dashboard looks like an answer. It is tempting to call a test after a couple of strong days.
The reality is that visitor behaviour shifts by day of week and by channel mix. A short test mostly measures that noise, not the change you made. Running a test across at least one full weekly cycle is the simplest way to average that noise out.
Myth: The Testing Tool’s Own Data Is Enough
Most conversion rate optimisation tools report a clear winner and a confidence percentage. It is tempting to stop there.
The reality is that a testing tool only shows whether a variation won, not why. Session recordings, heatmaps, and funnel reports from a separate analytics tool show where visitors hesitated or dropped off. That is what turns one winning test into the next good hypothesis. Our Google Analytics guide for beginners covers the reports worth checking first.
Myth: Only The Call-To-Action Button Is Worth Testing
The CTA button is the easiest thing to spot and the easiest thing to change. It becomes the default target for every test idea.
The reality is that headlines, page length, social proof, pricing display, and form length all influence whether a visitor ever reaches the button. A strong CTA on a page nobody trusts still converts poorly.
Myth: Cross-Browser Compatibility Is Not Worth Checking
A test result that looks strong in the tool’s own preview can seem safe to ship without a second check.
The reality, per StatCounter’s browser share data, is that Chrome carries roughly two-thirds of global traffic. A meaningful share is split across Safari, Edge, Firefox and others. A layout bug in any one of those can quietly depress the result for a slice of real visitors the dashboard never separates out.
Myth: A Winning Test Pays Off Immediately
Ending on a positive result reads like an instant win. Teams expect revenue to jump the moment the change goes live.
The reality is that most winning variations produce a small, incremental lift, not a step change. The gain compounds over many visitors and many months. It rarely shows up as an overnight spike in revenue.
Myth: Long Copy Always Hurts Conversion Rate Optimisation
Short attention spans get blamed for poor results. The advice to cut copy down becomes a reflex.
The reality is that length is not the variable that matters; relevance is. A visitor who is genuinely interested will read a long page if every paragraph earns its place. Nielsen Norman Group’s scanning research shows people skim for relevant cues, not that they refuse to read on principle.
Long copy fails for a different reason: it often repeats the same point several times, or buries the answer under throat-clearing. Cutting that kind of padding helps every visitor, long-copy fan or not, because it shortens the distance between the headline promise and the proof.
How To Lead With The Fix For Each Myth
Knowing the reality behind a myth is half the job. The other half is knowing what to actually do differently the next time you plan a test.
Copying A Winner: Lead With Your Own Hypothesis
Use a case study for inspiration, never as a plan. Write down why a change should work for your specific audience and page before you build the variation. That way, the test proves your reasoning, not someone else’s.
Short Tests: Lead With A Full Business Cycle
Set a minimum run time before the test starts. Cover at least one full week, so every day type is represented. Decide the stopping rule in advance so a lucky Tuesday cannot end the test early.
Tool-Only Data: Lead With Session Behaviour
Pair every test with a session recording or heatmap review of both variations. When a test loses, this is usually the only way to learn what to try next instead of guessing again.
CTA-Only Testing: Lead With The Page Around The Button
Before testing another button colour, test the headline, the proof above the fold, or the form length instead. Each one controls whether a visitor is ready to click long before they reach the button.
Skipping Browsers: Lead With A Spot Check On The Top Three
Preview every live test in the top three browsers for your audience before launch. Check layout and tracking in each one. A five-minute check prevents weeks of quietly corrupted data.
Expecting Instant Results: Lead With A Compounding Mindset
Track a winning change over a full quarter, not a week. Small, stacked wins across several tests usually beat waiting for one dramatic result.
Cutting Copy By Default: Lead With A Relevance Edit
Instead of cutting length first, cut anything that does not answer a real visitor question. What remains, however long, is more likely to convert than a short page that leaves questions unanswered.
How To Read Your Conversion Rate Optimisation Results
Each signal below is defined in one sentence, with the reading that matters more than the raw number.
- Conversion rate: conversions divided by visits. Read it against your own sector’s median, roughly 3.8% to 12.3%, not a single blended figure. For how this sits alongside acquisition and retention numbers, see our guide to online marketing metrics.
- Statistical confidence: the probability a result is not due to chance. Read a result below your tool’s standard confidence threshold as inconclusive, not as a loss.
- Sample size: the number of visitors who entered the test. Read a small sample alongside a wide confidence interval; a “winner” from too few visitors is still a guess.
- Test duration: how long the test ran. Read any test under one full week as unreliable, no matter how confident the early numbers look.
- Browser and device split: how results break down by browser and device. Read a result that only holds on one browser as a bug report, not a finding.
- Session recordings: real visitor behaviour on each variation. Read these when a test loses, to learn what to try next.
- Lift over baseline: the percentage change between the variation and the original. Read small, repeatable lifts as more valuable than one large, unverified spike.
The One Decision Rule: Do Not Trust A Result Before Its Full Cycle
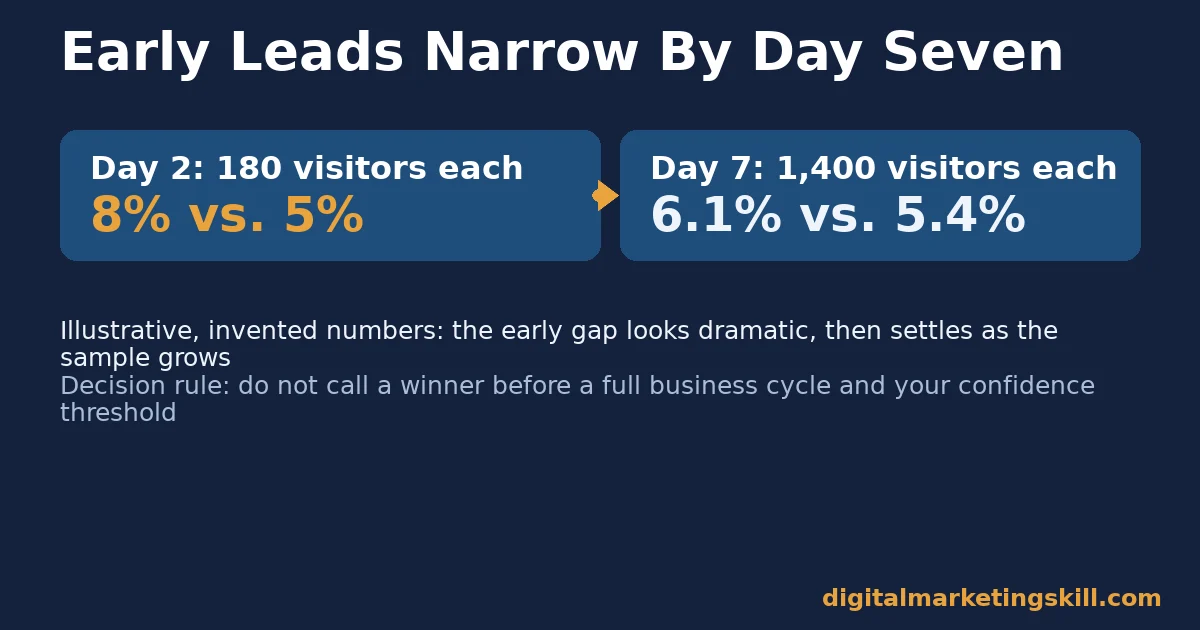
Apply this rule before calling any test: never declare a winner before the test has run a full business cycle, at minimum one full week, and reached your tool’s standard confidence threshold. A result that fails either condition is not evidence yet, no matter how large the gap looks.
Illustrative, invented numbers: say a test shows variation B converting at 8% against a 5% original after two days. That is only 180 visitors per variation, so the gap looks dramatic but the sample is too small to trust.
By day seven, with 1,400 visitors per variation, the gap narrows to 6.1% versus 5.4%. That is still a real lift, but a far smaller and more believable one than the early numbers suggested.
A Real Case: Why Small Samples Mislead Even Careful Teams
Nielsen Norman Group’s research on usability testing found that testing with 5 users uncovers about 85% of usability problems. A single user finds only about 31%. Its recommendation was to run several small studies rather than one large one, because each additional participant beyond the first handful adds less new information.
The limits matter here. That research covers usability testing, not conversion A/B testing, and the sample sizes involved are far smaller than a typical online test.
The principle still transfers, though. Early data points carry outsized weight. A team that stops too soon is extrapolating from a handful of visitors the same way an early usability test extrapolates from a handful of users. Once a winning test lifts revenue, protecting that gain becomes a retention question; our guide to conversion rate optimization ROI covers how to track whether the lift holds.
Frequently Asked Questions About Conversion Rate Optimisation
What is the most common conversion rate optimisation mistake?
Calling a test too early, before it has run a full business cycle and reached statistical confidence. Early leads frequently narrow or reverse once a full week of traffic has been measured.
How long should an A/B test run?
At least one full week, so every day-of-week pattern is represented. Run it longer if your traffic volume is low. Stop only once your testing tool reports the confidence level you set in advance.
Is a higher conversion rate always better for the business?
Not automatically. A change that lifts conversions but attracts lower-quality leads can hurt revenue even while the rate itself rises. Pair conversion rate with a downstream metric such as lead quality or repeat purchase.
Do I need a large audience to run conversion rate optimisation tests?
No, but a small audience needs patience. Low-traffic pages simply need longer test windows to reach the same statistical confidence that a high-traffic page reaches in days.
Should every test focus on the call-to-action button?
No. Headlines, social proof, page length, and form design often influence conversions more than button colour or text. Test the element you have a real hypothesis about, not the easiest one to change.
What should I check before trusting a test result?
Confirm the test ran a full business cycle and reached your tool’s confidence threshold. Also check that it holds up across your top browsers and devices. A result that fails any of these is not ready to ship.
Can a small business run real conversion rate optimisation tests?
Yes, with adjusted expectations. A small business should run fewer, bigger hypotheses rather than many small tweaks, and expect each test to take longer to reach confidence than it would on a high-traffic site.
Turn Conversion Rate Optimisation Into A Repeatable Skill
Testing gets easier once you can tell a real result from noise. If you want a structured way to learn conversion rate optimisation alongside analytics, content, and paid media, instead of picking it up by trial and error, the Digital Marketing Skill Institute’s Master Diploma in Digital & AI Marketing covers nine practical courses, with unlimited one-on-one coaching and mentoring and real project work inside a U.S. company.
The program is dual US and UK accredited and recognised in more than 100 countries. It is delivered 100% online, so you can study and test real campaigns wherever you live in your country.
Explore more breakdowns like this one on the Digital Marketing Skill Institute blog, read outcomes on the reviews page, and when you are ready, apply to start testing with a method that holds up.
Visit digitalmarketingskill.com to see the full course catalogue, or come back to digitalmarketingskill.com any time you need another data-backed guide like this one.
Every figure in this guide was checked against its original source before publication. Figures marked as illustrative are invented examples, not real results.
![9 Amazing Digital Marketing Skills to Make Money Online [With Proof]](https://digitalmarketingskill.com/wp-content/uploads/2019/07/9-Amazing-Digital-Marketing-Skills-to-Make-Money-Online-With-Proof-17.png)






