

Online marketing metrics turn guesswork into evidence. They show which channels bring visitors and which pages convert them. They also reveal which customers stay long enough to repay what you spent to find them. This guide covers the online marketing metrics that matter, how to read them together, and the one ratio that decides whether you scale a channel or fix it first.
Key Takeaways
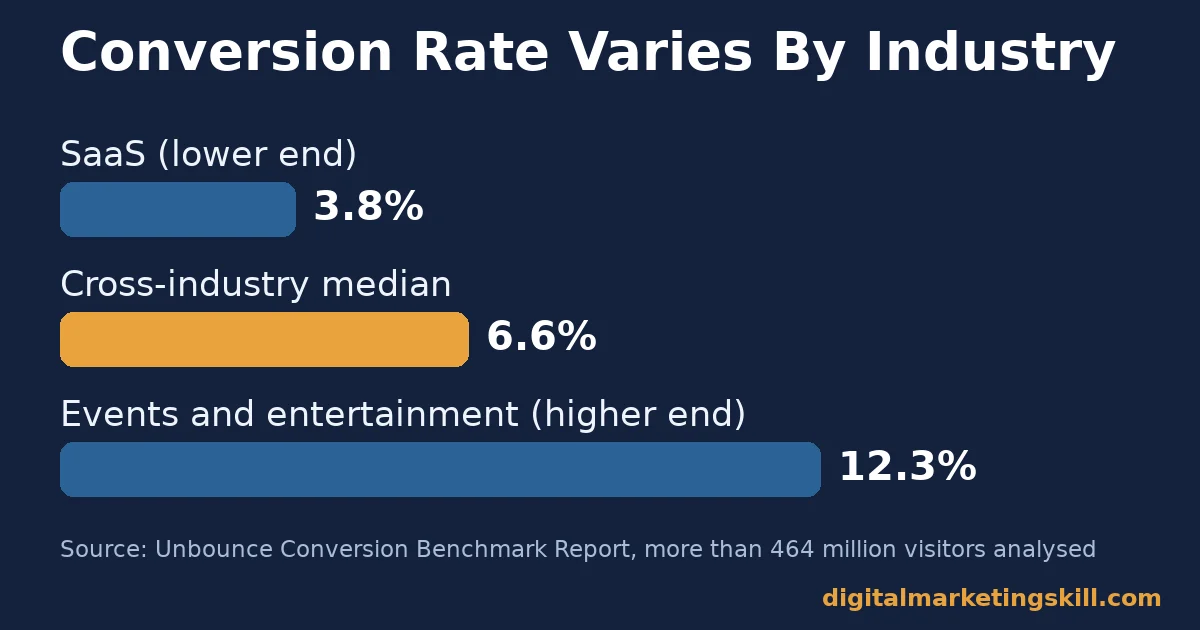
- Landing pages convert at a median of 6.6% across industries, according to Unbounce’s Conversion Benchmark Report of more than 464 million visitors and 57 million conversions. The figure ranges from 3.8% in SaaS to 12.3% for events and entertainment, so compare your number to your own sector first.
- Marketers report earning $10 to $36 back for every $1 spent on email, according to Litmus’s State of Email survey of roughly 500 marketing professionals. Email stays one of the highest-return channels worth isolating in your online marketing metrics.
- A 3:1 ratio of customer lifetime value to customer acquisition cost is the commonly cited healthy benchmark, according to Klipfolio’s LTV:CAC guide. Ecommerce businesses often target closer to 2:1, because margins run thinner.
- Bain & Company research by Frederick Reichheld found that retaining just 5% more customers can lift profit by close to 100% in service businesses. Retention metrics deserve as much attention as acquisition metrics.
- Brands that track email performance with a dedicated analytics tool see 43% higher ROI than brands that do not, according to Litmus. Measurement itself is part of the return.
In this guide
- The Online Marketing Metrics Gap Most Businesses Fall Into
- How Online Marketing Metrics Actually Work
- How To Lead With Each Online Marketing Metric
- How To Read Your Online Marketing Metrics Dashboard
- The One Online Marketing Metrics Decision Rule
- A Real Case: What Retention Economics Looks Like
- Frequently Asked Questions About Online Marketing Metrics
- Turn Your Online Marketing Metrics Into A Growth Plan
The Online Marketing Metrics Gap Most Businesses Fall Into
Most businesses collect plenty of marketing data. Few turn that data into a decision. A dashboard full of numbers is not the same as knowing what to do next.
This guide is an informed framework, not a universal formula. Your channel mix, your margins, and your sales cycle all change which online marketing metrics matter most. Treat the ratios below as starting points. Test them against your own numbers; do not copy them blindly.
Two ground rules keep metrics useful instead of misleading. First, never read a metric alone. A rising bounce rate means something different on a blog post than on a checkout page. Second, always ask what decision a number should support. If a metric cannot change what you do next, it is trivia, not a KPI.
A third habit prevents the most common mistake with online marketing metrics: comparing numbers across time periods that are not actually comparable. A holiday sales spike, a one-off press mention, or a seasonal dip can all distort a month-over-month comparison into something that looks like a trend.
Before reacting to any single number, check whether the period you are comparing against had its own unusual event. Note that event next to the figure so future readers do not misread it either.
How Online Marketing Metrics Actually Work
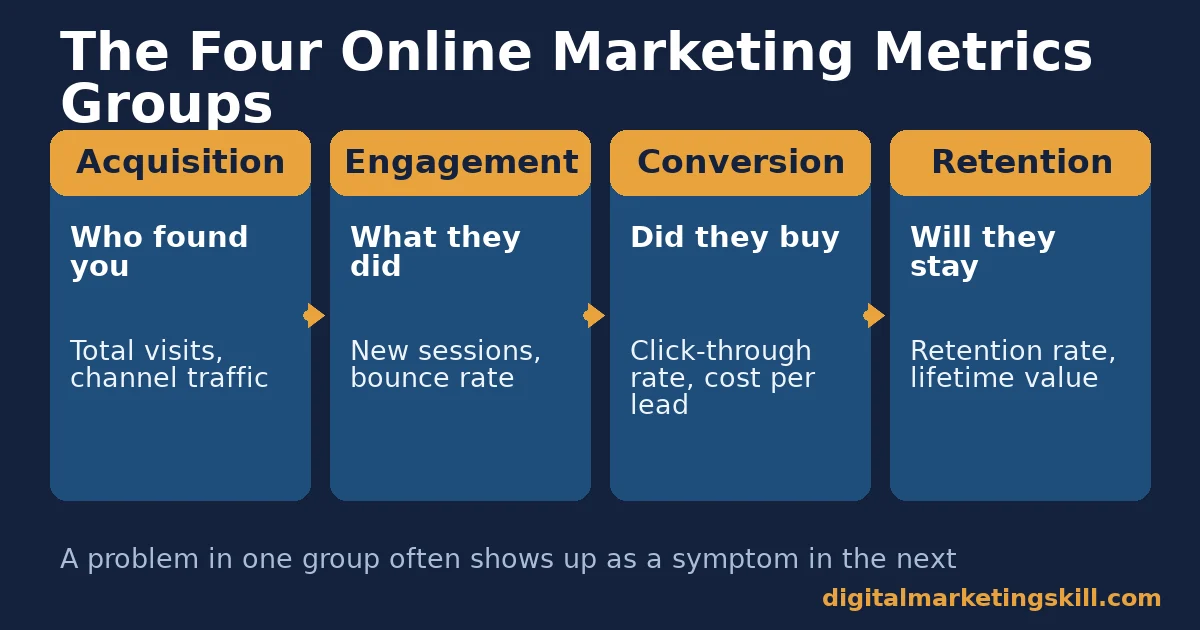
Every marketing metric answers one of four questions. Who found you? What did they do? Did they buy? Will they come back? Grouping metrics this way, instead of listing them alphabetically, makes it easier to see which part of the funnel is broken.
Acquisition metrics answer who found you: total visits and channel-specific traffic. Engagement metrics answer what visitors did once they arrived: new sessions, bounce rate, time on page. Conversion metrics answer whether attention turned into revenue: click-through rate, total conversions, cost per lead. Retention and value metrics answer whether the business you won is worth keeping: customer retention rate, customer lifetime value, ROI.
These four groups sit in sequence, so a problem in one group often shows up as a symptom in the next. Low conversions, for example, can actually be a traffic-quality problem wearing a conversion-problem disguise. The visitors who arrived were never a good match for the offer.
Attribution adds one more layer worth naming early. Most online marketing metrics tools default to last-click attribution, crediting the final touchpoint before a sale. That view undercounts channels that build awareness early, such as social or display, because those channels rarely close a sale directly.
A simple fix is to check a second model, such as first-click or linear attribution, alongside your default report. Compare how differently each one ranks your channels. Large swings between models are a signal: a channel’s true value may be hidden, not that the channel is failing.
Acquisition Metrics: Built For Volume
Total visits is the simplest acquisition metric. It counts how many times users load your site in a given period, counting both new and returning visitors. Google Analytics defines this as sessions. It gives you a big-picture read on whether a campaign drives traffic at all, and whether that traffic is growing, flat, or shrinking month over month.
Channel-specific traffic breaks that same number down by source: direct, organic search, referral, and social. “Total visits” alone cannot tell you which channel is working. A campaign can look healthy overall while one channel quietly declines and another compensates for it. If search is your main channel, pair this view with the basics in our Google Analytics guide for beginners.
Engagement Metrics: Built For Attention
New sessions compare first-time visitors to returning ones. This tells you whether a site is sticky enough to earn repeat attention, and whether outreach reaches new audiences or just re-engages the same small group.
Bounce rate shows the share of visitors who leave without further interaction. A cross-industry median bounce rate sits near the mid-40s percent range. It runs closer to 38% for e-commerce and closer to 48% for SaaS or IT services, so judge your own rate against similar sites, not one universal number.
Modern analytics platforms report the inverse view too. Google Analytics defines an engaged session as one that lasts 10 seconds or longer, triggers a key event, or includes two or more page views. Engagement rate (the share of sessions meeting that bar) rises as bounce rate falls. Tracking both sides of this coin, among your online marketing metrics, catches changes a single number can hide.
Conversion Metrics: Built For Revenue
Click-through rate measures the share of people who click a link, ad, or call-to-action compared with everyone who saw it. Use it as a relative metric. Compare one headline, subject line, or ad creative against another, instead of chasing an abstract “good” number.
Email is a good place to practise this first. Our guide to lifting email click-through rate walks through the subject-line and layout tests that move this number fastest.
Total conversions and cost per lead translate attention into a dollar figure. A conversion can be a form fill, a checkout, or a demo booking. Cost per lead divides channel spend by the leads that channel generated. That is what lets you compare a paid campaign against an organic one on equal terms.
Retention And Value Metrics: Built For Longevity
Customer retention rate is the share of customers who buy again after their first purchase. It is the clearest single signal of whether a product is actually sticky, independent of how good the marketing that won the customer was.
Customer lifetime value estimates the total revenue a business can expect from one customer across the whole relationship, not just the first sale. It is the number that should decide how much a business can afford to spend acquiring a customer. When retention slips, the fix is rarely one tactic; our breakdown of customer retention strategies covers the four levers behind this number.
How To Lead With Each Online Marketing Metric
Knowing what a metric measures is half the job. The other half is knowing which metric to act on first when something looks wrong, and in what order to check the rest.
Acquisition Metrics: Lead With Channel Attribution
Before changing anything, confirm which channel actually moved. Open the channel breakdown first, not the total-visits chart. A flat total can hide a declining channel offset by a growing one. Fix or defend the specific channel that moved, instead of making a blanket change to the whole campaign.
Engagement Metrics: Lead With Session Quality
When bounce rate rises, check session quality before touching design. Did a new channel bring in a less relevant audience? Or did the page stop matching what visitors expected after a recent edit? The fix for mismatched traffic is a targeting change. The fix for a confusing page is a content change. Applying the wrong one wastes a redesign cycle.
Conversion Metrics: Lead With Funnel Diagnosis
When conversions fall, diagnose where in the funnel visitors drop off before rewriting copy. A weak click-through rate on an ad points to the message. A strong click-through rate followed by few conversions points to the landing page or the offer itself. Treat these as separate problems, because the fix for each is different.
Retention And Value Metrics: Lead With Lifetime Value
When growth stalls despite healthy traffic, check lifetime value against acquisition cost before increasing ad spend. A business that pours more budget into acquisition while retention quietly erodes is often refilling a leaking bucket, not growing it. Fixing onboarding or support often buys more growth per dollar than another acquisition campaign. See how that trade-off plays out in our look at conversion rate optimization ROI.
How To Read Your Online Marketing Metrics Dashboard
Each KPI below is defined in one sentence, with the reading that matters more than the raw number.
- Total visits: the count of site loads in a period. Read the trend over months, not the single number.
- New vs. returning sessions: the split between first-time and repeat visitors. A falling returning share is an early loyalty warning.
- Channel-specific traffic: visits segmented by source. It shows which channel drives the trend in total visits.
- Bounce rate: the share who leave without further interaction. Read it against page type; a single blog post naturally bounces higher than a product page.
- Click-through rate: clicks divided by impressions. Read it as a comparison between creative variants, not an absolute score.
- Conversion rate: conversions divided by visits or impressions. Read it against the median for your industry, roughly 3.8% to 12.3%, rather than one blended average.
- Cost per lead: channel spend divided by leads generated. Read it alongside lead quality; a cheap lead that never closes is not actually cheap.
- Lead-to-close ratio: closed sales divided by total leads. A falling ratio points to a sales-process problem, not a marketing one.
- Customer retention rate: the share of customers who buy again. Read it as the multiplier on every acquisition dollar you spend.
- Customer lifetime value (LTV): expected revenue per customer over the full relationship. Read it next to acquisition cost, never alone.
- LTV:CAC ratio: lifetime value divided by acquisition cost. Read 3:1 as the commonly cited healthy line, lower for thin-margin ecommerce.
The One Online Marketing Metrics Decision Rule
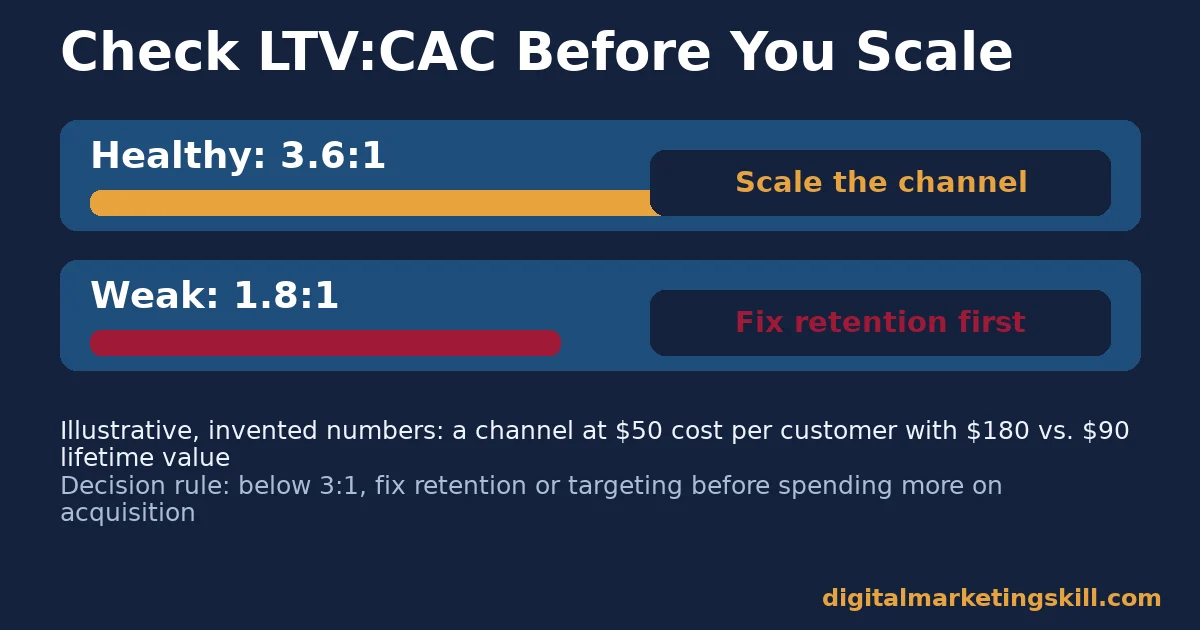
Apply this single rule before increasing budget on any channel: if your LTV:CAC ratio is below 3:1, fix retention or targeting before you spend more on acquisition. Only scale a channel once that ratio holds at 3:1 or better. A ratio near or below 1:1 means the business loses money on every customer it wins, no matter how good the acquisition metrics look.
Illustrative, invented numbers: say a business spends $12,000 a month on a channel that brings 240 new customers. That is a cost per acquisition of $50. If the average customer is worth $180 over their lifetime, the ratio is 3.6:1, comfortably above the benchmark, so scaling that channel is reasonable.
If lifetime value is actually $90, because retention is weak, the ratio drops to 1.8:1. The better move then is fixing onboarding and retention before adding more acquisition spend.
A Real Case: What Retention Economics Looks Like
Frederick Reichheld’s research for Bain & Company, published in Harvard Business Review, found that retaining just 5% more customers can increase profit by close to 100% in service businesses. His example was MBNA America, a credit card issuer whose customer defection rate ran at roughly half the industry average. Over eight years, the company’s profits grew sixfold.
The limits matter here. This is one company, in one industry, measured decades ago, and the relationship is correlational, not a controlled experiment. It does not prove that any single business will see the same multiple from the same retention gain. It does show the direction: small improvements in retention tend to matter more than they first appear, because they compound across every future purchase a kept customer makes.
Smaller businesses see a version of this compounding effect too, even without a famous case study behind it. A service business that lifts its repeat-purchase rate from 20% to 25% is not just adding five percentage points.
It is adding a full extra cycle of revenue from every fifth customer, without spending another dollar on acquisition. That is why retention metrics belong in the same weekly report as acquisition metrics, not in a separate, less-visited dashboard.
Frequently Asked Questions About Online Marketing Metrics
What are the most important online marketing metrics to track first?
Start with one metric from each of the four groups. Pick a traffic metric (channel-specific traffic), an engagement metric (bounce rate), a conversion metric (conversion rate or cost per lead), and a value metric (customer retention rate or LTV:CAC). That combination shows the whole funnel, not just one slice of it.
How is online marketing ROI calculated?
Divide the profit a campaign generates by its total cost, then express the result as a ratio or percentage. The honest version of this calculation includes every cost, including management time and tools, not just media spend. That is why cost per lead and lifetime value need to feed into the same calculation.
What is a good conversion rate for a landing page?
There is no single good number. Medians range from about 3.8% in SaaS to 12.3% in events and entertainment, according to Unbounce’s benchmark analysis. Compare your rate to your own sector’s median and to your own past performance, not to a figure from an unrelated industry. If you are running tests to move that number, our guide to conversion rate optimisation myths covers how to tell a real result from noise.
How often should a business review its marketing metrics?
Review acquisition and engagement metrics at least monthly; they move quickly with campaign changes. Review retention and lifetime-value metrics quarterly, because they need more time and more customers to produce a reliable signal.
What is the difference between a metric and a KPI?
A metric is any number you can measure, such as total visits. A KPI, or key performance indicator, is a metric tied directly to a business goal, with a target and an owner. Every KPI is a metric, but not every metric deserves to be a KPI.
How do you calculate customer lifetime value?
A simple version multiplies average order value by average purchase frequency by average customer lifespan. More advanced models also factor in gross margin and the cost of serving the customer. That produces a more conservative, more decision-useful number.
What is a healthy LTV:CAC ratio?
A ratio of 3:1 is the commonly cited healthy benchmark. It means a business earns roughly three dollars of lifetime value for every dollar spent acquiring a customer. Thin-margin businesses, such as some ecommerce categories, often target closer to 2:1 instead, because there is less room between revenue and cost.
Do online marketing metrics matter more than the strategy behind them?
No single metric replaces strategy. Metrics tell you where a plan is working and where it is not; they do not design the plan for you. Treat online marketing metrics as a feedback loop that sharpens strategy, not a substitute for having one.
What is a vanity metric, and how do you spot one?
A vanity metric looks impressive but does not connect to revenue or retention, such as raw follower counts or page views with no link to conversions. Spot one by asking whether the number would change your next decision. If a metric cannot tell you to spend more, spend less, or fix a page, it belongs in a footnote, not a dashboard headline.
Turn Your Online Marketing Metrics Into A Growth Plan
Metrics only matter once someone knows how to act on them. If you want a structured way to build acquisition, conversion, and retention skills together, instead of learning each one in isolation, the Digital Marketing Skill Institute’s Master Diploma in Digital & AI Marketing covers nine practical courses, from analytics to paid media to retention marketing, with unlimited one-on-one coaching and mentoring and real project work inside a U.S. company.
The program is dual US and UK accredited and recognised in more than 100 countries. It is delivered 100% online, so you can study wherever you live and still work directly with a mentor on real campaigns.
Explore more breakdowns like this one on the Digital Marketing Skill Institute blog, read outcomes on the reviews page, and when you are ready, apply to start building a measurement habit that actually drives decisions, anywhere in your country.
Visit digitalmarketingskill.com to see the full course catalogue, or come back to digitalmarketingskill.com any time you need another data-backed guide like this one.
Every figure in this guide was checked against its original source before publication. Figures marked as illustrative are invented examples, not real results.
![9 Amazing Digital Marketing Skills to Make Money Online [With Proof]](https://digitalmarketingskill.com/wp-content/uploads/2019/07/9-Amazing-Digital-Marketing-Skills-to-Make-Money-Online-With-Proof-17.png)






