
Conversion rate optimization ROI depends less on the tool you buy than on how you test. A single underpowered A/B test can waste weeks of traffic and still tell you nothing useful. This guide covers the benchmarks, the math behind a valid test, and the mistakes that quietly erase the return.
Key Takeaways
- Averages hide the real opportunity. Wingify’s benchmark research puts typical website conversion rates between about 1.8% and 4.6% depending on industry.
- Most companies never formalize the process. Industry research cited by Wingify found only 39.6% of companies have a formally documented conversion rate optimization strategy.
- Carts are abandoned more often than not. Baymard Institute’s analysis of 50 separate studies puts the average cart abandonment rate at 70.22%.
- Speed is part of the conversion rate. In Vodafone’s own case study published by web.dev, a 31% improvement in page load speed increased sales by 8%.
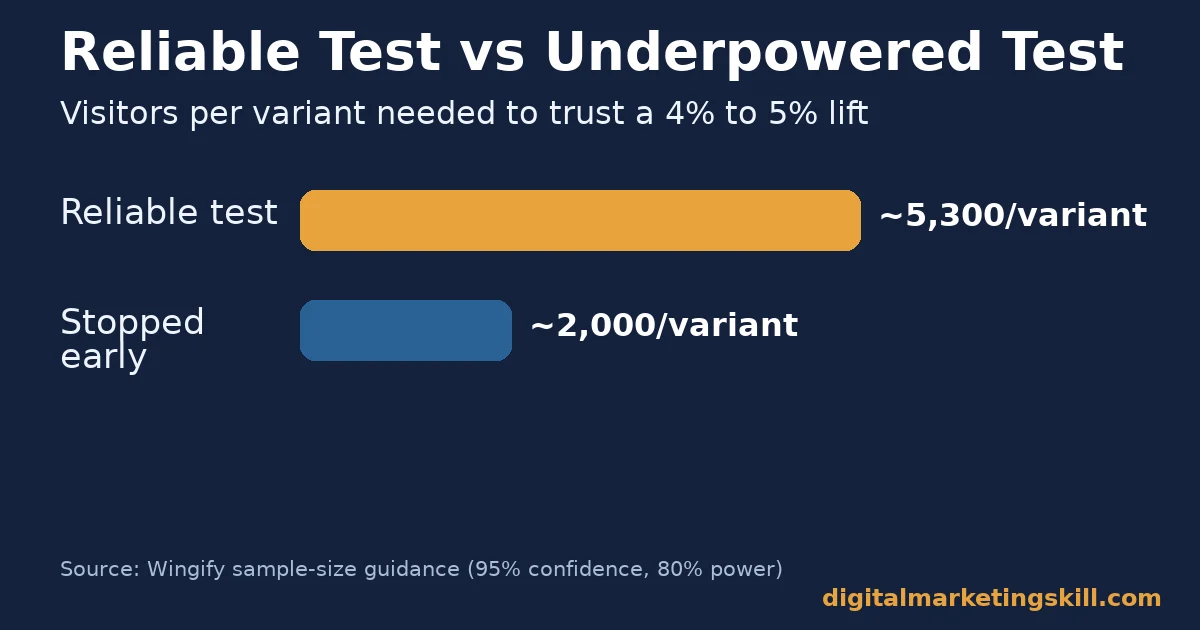
- Underpowered tests are the most common way ROI disappears. A standard test uses 95% confidence and 80% power. Moving a 4% baseline to an expected 5% result needs roughly 5,300 visitors per variant, per Wingify’s sample-size guidance. Smaller samples produce results you cannot trust.
In this guide
- What Most Conversion Rate Optimization Advice Skips
- How Conversion Rate Optimization ROI Is Actually Calculated
- What Differs by Starting Point
- How to Lead With Each Starting Point
- How to Measure Conversion Rate Optimization ROI
- Which Page to Test First
- The One Rule: Never Call a Test Before It Reaches Its Planned Sample Size
- A Simple Checklist for Running a Valid Test
- Common Mistakes That Quietly Erase Conversion Rate Optimization ROI
- A Real Case: What Better-Targeted Spend Did for One Student
- Frequently Asked Questions About Conversion Rate Optimization ROI
- Build the Skill, Not Just the Habit
What Most Conversion Rate Optimization Advice Skips
Most advice lists tactics. Change the button color. Shorten the form. Add a trust badge. Some of that works. But it skips the part that decides whether any of it counts as a win: whether the test itself was valid.
This guide treats conversion rate optimization as a measurement discipline first and a design discipline second. The benchmark figures below come from industry research and named case studies. Read them as a general picture, not your own number. Treat each one as a snapshot from one dataset, not a permanent industry truth.
A useful way to think about conversion rate optimization ROI is to separate what you control from what you measure. You control the hypothesis, the sample size and when you stop a test. You only measure the result; you cannot will a weak idea into a strong lift by watching the dashboard more closely.
How Conversion Rate Optimization ROI Is Actually Calculated
ROI on a CRO program is the extra revenue a change produces, divided by what the test and the team cost to run. That sounds simple. In practice, most of the hidden cost comes from tests that run too short, measure the wrong thing, or get called early.
Why Sample Size Decides Whether ROI Is Real
A test with too few visitors can show a lift that is pure noise. Wingify’s guidance describes a standard calculation using 95% confidence and 80% power. Detecting a move from a 4% baseline to a 5% conversion rate needs about 5,300 observations per variant.
Smaller tests are faster to run. They are also far more likely to mislead you. A result that looks exciting at 1,000 visitors often settles into something much smaller, or disappears entirely, by the time it reaches a reliable sample.
Why Test Duration Changes the Result
Even with enough visitors, a short test can catch an unusual day rather than a real pattern. Running a test across full weekly cycles, not just a few days, captures the normal swing between weekdays and weekends. Wingify’s sample-size guidance walks through the full calculation if you want to set this up yourself.
What Differs by Starting Point
Where your conversion rate optimization ROI comes from depends on what is already broken. The headings below name three common starting points, then show how to lead with each one.
Slow Pages: Built to Lose Visitors Before They Decide
In Vodafone’s case study, published by web.dev, a 31% improvement in largest contentful paint increased sales by 8%. Largest contentful paint measures how fast the main content loads. Visitors do not file a complaint about a slow page. They simply leave, so this loss shows up as a quieter funnel, not a support ticket.
High-Friction Forms: Built to Filter Out the Impatient
Baymard Institute’s checkout research found the average US checkout displays about 23 form elements. Its own usability testing found 12-14 elements are enough for a well-designed flow. Every extra field is a small tax on the visitor’s patience. Long forms lose busy, high-intent visitors as often as careless ones.
Thin Trust Signals: Built to Raise Doubt at the Worst Moment
A checkout or signup page with no reviews, no clear guarantee and no visible security cue asks the visitor to take the final step on faith. That doubt peaks exactly at the point you need confidence most.
How to Lead With Each Starting Point
The headings below mirror the three above. Fix whichever one is costing you the most traffic today, then move to the next.
Slow Pages: Lead With the Biggest Single Fix
Compress images and defer non-critical scripts. Test the checkout or signup path specifically, since that is where speed losses cost the most. A single large image or a bloated script is often responsible for most of the delay on one page. Our on-page SEO checklist covers several of the same technical fixes that help load speed.
High-Friction Forms: Lead With Fewer Fields
Remove every field you do not strictly need to complete the transaction, and move optional fields to a later step after the visitor has committed. Our guide to fixing landing page friction before you test covers which fields to cut first. Our guide to reducing bounce rate covers several of the same friction points from a different angle.
Thin Trust Signals: Lead With Specific, Checkable Proof
Replace vague claims with a specific number, a named reviewer, or a visible guarantee near the action button. Specific proof reduces doubt faster than generic reassurance text, because it gives the visitor something concrete to check rather than take on faith.
How to Measure Conversion Rate Optimization ROI
A conversion rate optimization program only proves its value if you track the right numbers consistently. Review these four metrics for every test, not just the final result. Skipping this step is how a program keeps running tests without anyone being able to say what the overall conversion rate optimization ROI actually was for the quarter.
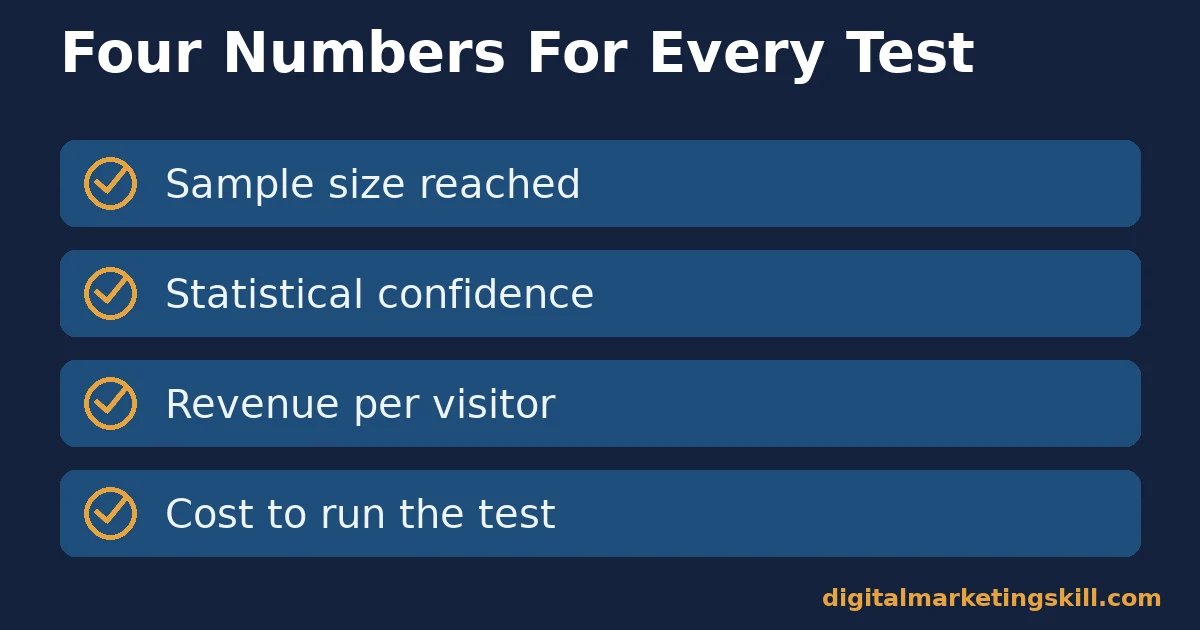
Four Numbers That Show Whether a Test Was Worth Running
- Sample size reached: the number of visitors or conversions each variant actually collected. Check it against your pre-test calculation, not against how long the test felt like it ran.
- Statistical confidence: whether the result clears your chosen threshold, typically 95%, before you act on it. A result below that threshold is a hint, not a decision.
- Revenue per visitor: not just conversion rate alone, since a cheaper offer can lift conversions while lowering total revenue. Our guide to reading Google Analytics reports with intent covers where to find this number.
- Cost to run the test: developer time, design time and the lost revenue from traffic sent to a losing variant. This way, the ROI calculation reflects the full cost, not just the win.
Which Page to Test First
Most sites have more test ideas than traffic to run them on. Prioritizing badly is its own drain on conversion rate optimization ROI, since a clever test on a low-traffic page can take months to reach a reliable sample. A simple scoring method, ranking each idea by expected impact, confidence and ease of building it, keeps this decision from becoming a matter of whoever argues loudest in the planning meeting.
Start With High-Traffic, High-Intent Pages
A product or pricing page with heavy traffic reaches your required sample size far faster than a blog post or an about page. The same percentage lift is also worth more in absolute revenue on a page people already intend to buy from.
Then Target Pages With a Known Drop-Off
Use your analytics to find the step in the funnel where the largest share of visitors leaves. A checkout page that loses a third of visitors at one specific field is a stronger candidate than a page with no obvious friction point.
Check Mobile and Desktop Separately
Mobile and desktop visitors often behave differently on the same page, so a change that helps one can do nothing, or even hurt, on the other. Where traffic allows, review the result split by device before deciding a test applies site-wide.
Weigh Effort Against Expected Lift
A small copy change costs little to build and test. Redesigning a full page costs far more in design and development time. When two ideas seem similarly promising, test the cheaper one first and save the expensive rebuild for an idea with stronger supporting evidence.
The One Rule: Never Call a Test Before It Reaches Its Planned Sample Size
Calculate the sample size before you start the test, and do not stop early just because the result looks good. Checking results daily and stopping the moment they look significant is a habit known as peeking. It is one of the most common ways teams turn a real cost into a false win.
Illustrative, invented numbers: imagine a test needs 5,300 visitors per variant to be reliable. At 2,000 visitors, variant B shows a tempting 15% lift, so the team ships it early.
By 5,300 visitors, the real lift has settled at 2%, a result that would not have justified the engineering cost. Stopping early did not create the loss. It just hid the loss until after the decision was made.
A Simple Checklist for Running a Valid Test
Most conversion rate optimization ROI problems trace back to skipping one of these steps, not to picking the wrong element to test. Run through this list before, during and after every test.
Before You Launch
- Write down the exact hypothesis: what you are changing, why you expect it to help, and which metric will prove it.
- Calculate the required sample size from your current baseline conversion rate and the smallest lift worth acting on.
- Decide the test’s stop date in advance, based on that sample size, not on a fixed number of days.
While It Runs
- Resist checking results daily. Early numbers swing far more than numbers collected over a full sample.
- Watch for external events, a sale, a press mention, a holiday, that could distort one variant more than the other.
- Confirm the test is tracking correctly within the first day, since a broken tracking tag can run for weeks unnoticed.
After It Ends
- Check the result against your planned sample size and confidence threshold before declaring a winner.
- Look at revenue per visitor alongside conversion rate, in case the win came from a cheaper average order.
- Record what you learned even from a losing test, since a clear non-result still rules out a bad idea.
Common Mistakes That Quietly Erase Conversion Rate Optimization ROI
Most testing programs do not fail loudly. They lose their return a little at a time, through habits that feel reasonable in the moment. Watching for these patterns is often the fastest way to improve conversion rate optimization ROI without running a single new test.
Checking Results Daily and Stopping Early
This is the single most common way a real cost turns into a false win, as the decision-rule section above explains. A result that looks strong on day three often fades by day fourteen.
Running Too Many Tests on Too Little Traffic
Splitting limited traffic across five simultaneous tests means none of them reach a reliable sample size in a reasonable timeframe. It is usually better to run fewer tests, one after another, each with enough traffic to finish properly. Baymard Institute’s own research process tests one checkout change at a time for exactly this reason.
Optimizing for Clicks Instead of Revenue
A variant can win on click-through rate while losing on actual revenue, if it attracts more low-intent clicks or a lower average order value. Always check the revenue-per-visitor metric from the measurement section above before declaring a result a win.
Treating a Single Win as a Permanent Fact
Audiences, prices and competitors change. A page that won a test can quietly stop converting as well over time. web.dev’s own performance research notes that speed budgets drift as pages pick up new scripts and images, which is one reason even a page that tested well once is worth re-checking. Revisit your best-performing pages periodically rather than assuming an old winner is still correct.
A Real Case: What Better-Targeted Spend Did for One Student
Among the published outcomes on Digital Marketing Skill Institute’s reviews page, one student reports spending $14 on paid social ads and generating $878 in sales from that campaign. That return depends on the landing page converting the traffic well, not just the ad itself.
This is a single, self-reported result from one account, not a guarantee. See our earnings disclaimer for how to read results like this one.
Frequently Asked Questions About Conversion Rate Optimization ROI
What is a good conversion rate optimization ROI?
There is no single good number, because it depends on your baseline conversion rate, your margins and what the test cost to run. Compare each test’s return against your own historical average rather than a published benchmark from a different industry.
How long should an A/B test run?
Long enough to reach the sample size your baseline conversion rate and desired lift require, and across full weekly cycles so weekday and weekend behavior both get captured. Stopping on a calendar date rather than a sample size is a common source of false results.
Why did my test show a big lift that disappeared later?
This usually means the test was stopped before reaching its planned sample size. Early results swing more widely than later ones, so an exciting early lift often fades as more visitors are added to the test.
Does a faster website actually increase conversion rate optimization ROI?
Speed is one of the more reliable levers. In Vodafone’s case, a 31% improvement in page load speed increased sales by 8%. Speed affects every page at once, so it is often one of the highest-leverage fixes available before you test individual page elements.
Should I test one element at a time or redesign the whole page?
Both have a place. Testing one element at a time tells you exactly what caused a result, while a full redesign can clear several small frictions at once but makes it harder to know which change mattered. Start with whichever your current sample size can support within a reasonable timeframe.
Do conversion rate optimization tools pay for themselves?
Research cited by testing-tool vendors reports an average 223% return on investment from using these tools. That figure comes from the vendors’ own aggregated customer data, so treat it as directional. Treat it as a directional signal and measure your own return against your actual testing costs.
Why do so many carts get abandoned even on pages that convert well?
Baymard Institute’s analysis of 50 studies found an average cart abandonment rate of 70.22%. That figure includes browsers who never intended to buy, alongside genuine checkout friction. A high abandonment rate on its own does not prove your checkout is broken; compare it against your own trend over time instead.
How many tests should run at the same time?
As few as your traffic allows you to finish properly. A busy site with distinct, non-overlapping pages can often run two or three tests at once, while a smaller site usually gets better conversion rate optimization ROI from running one test at a time and finishing it fast.
Who should own conversion rate optimization in a small team?
One person should own the testing calendar and the final call on whether a result is reliable, even if designers and developers build the variants. Without a single owner, tests tend to get stopped early by whoever is watching the dashboard that day.
Build the Skill, Not Just the Habit
Conversion rate optimization ROI improves fastest when the person running the tests also understands analytics, landing pages and paid traffic, not just button colors. Digital Marketing Skill Institute’s Master Diploma in Digital & AI Marketing includes AI-powered Google Analytics and AI-powered lead generation courses alongside the rest of the curriculum.
The program comes with unlimited one-on-one mentoring and real project-based work experience with a U.S. partner company. It is dual US and UK accredited, recognised in more than 100 countries, and 100% online, so you can study from anywhere in your country.
Explore the full curriculum on the Master Diploma in Digital & AI Marketing page, read more outcomes on our reviews page, or browse more guides on the digital marketing blog. When you are ready, apply here. This works wherever you live, since the whole program runs online. Learn more at https://digitalmarketingskill.com/, or start your application today at https://digitalmarketingskill.com/.
Every figure in this guide was checked against its original source before publication. Figures marked as illustrative are invented examples, not real results.
![9 Amazing Digital Marketing Skills to Make Money Online [With Proof]](https://digitalmarketingskill.com/wp-content/uploads/2019/07/9-Amazing-Digital-Marketing-Skills-to-Make-Money-Online-With-Proof-17.png)






