
Cohort Analysis is a way of grouping users who share a starting point, such as the week they first visited or bought, and then tracking how each group behaves over time. Instead of looking at all users as one big crowd, you compare groups side by side. As a result, you can see whether people stay, come back or spend more. So it is one of the clearest ways to measure retention and the real impact of your marketing.
Key Takeaways
- A cohort is a group of users who share a common trait, often the date they first arrived.
- Cohort analysis tracks each group over the same time steps, such as week 1, week 2 and week 3.
- It shows retention, repeat purchases and value in a way that overall totals can hide.
- In Google Analytics 4, you run it with the Cohort exploration in the Explore section.
- Good cohort work leads to action, such as fixing onboarding or changing which campaigns get budget.
What Is Cohort Analysis?
Google Analytics puts it simply: “A cohort is a group of users who share a common characteristic.” For example, everyone who first used your app in the first week of a month forms one cohort. Then everyone who joined the next week forms another.
Cohort analysis compares these groups over equal time periods. So you can ask, “Of the people who joined in week 1, how many came back in week 2?” Then you ask the same question for the week 2 group. As a result, you can see whether things are getting better or worse.
Think of a gym. In January, lots of new members sign up. However, the total number of members alone won’t tell you how many January joiners still come in March. By contrast, a cohort view shows that clearly. It also lets you compare January joiners with February joiners, who may have had a better welcome programme.
Cohorts don’t have to be based on dates. For instance, you can group users by the campaign that brought them, the device they used or their first product. However, date-based cohorts are the most common, because they make it easy to compare like with like.
Why It Matters
Overall numbers can hide problems. For example, total active users may rise because you spend more on ads, while each new group drops off faster. In that case, your growth looks healthy but your churn rate is getting worse. Cohort analysis shows this early. Likewise, it helps you see whether a change to your product, emails or offers really kept people around. That is why analysts and growth teams use it so often.
How Cohort Analysis Works
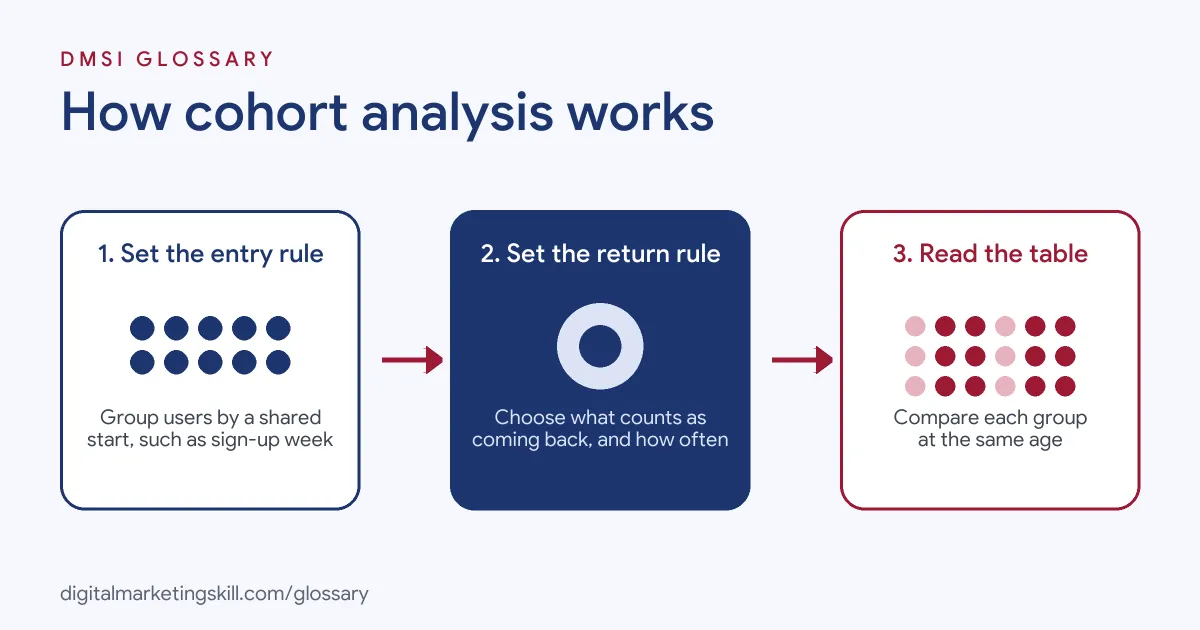
Cohort analysis follows a simple pattern. First, you choose who enters each group. Then you choose what counts as coming back. Finally, you read a table that shows each group over time.
Step 1: Set the Entry Rule
The entry rule decides who joins a cohort. In Google Analytics 4, this is called cohort inclusion. Google says it “Defines the initial condition a user has to meet to be included in a cohort.” For example, the rule could be a first visit, a sign-up or a first purchase.
Step 2: Set the Return Rule
Next, you decide what counts as a return. GA4 calls this the return criteria. For instance, it could be any event, a purchase or one of your key events. Then you pick the time size. GA4 offers daily, weekly and monthly cohort granularity. Also, its weekly view runs “from Sunday to Saturday included, not on a rolling 7 days.”
Step 3: Read the Cohort Table
Then the tool builds a grid. Each row is one cohort, and each column is a time step after entry. Each cell shows a value, such as the share of users who returned. As a result, you read across a row to see how one group fades. Meanwhile, you read down a column to compare groups at the same age.
Many tools also draw a retention curve. Mixpanel explains that “Users are bucketed based on when they initially entered the product.” So the curve shows how fast each group drops off. Usually, the line falls sharply at first and then flattens. A flatter line means more users found lasting value. Also, darker shading in the table often marks the strongest cells, which makes patterns easy to spot.
Choose How to Count
Finally, GA4 lets you choose a calculation type. Standard counts users who return in each single period. By contrast, rolling counts users who return in that period and every earlier one. Cumulative adds up results across all periods so far. In addition, a breakdown “Divides each cohort into sub-groups based on a selected dimension,” such as device or country.
Examples of Cohort Analysis
- A subscription app checks onboarding. The team groups users by sign-up week. After a new welcome flow goes live, the newer cohorts show more users still active in week 4. So the team keeps the new flow.
- An online shop compares ad channels. The shop groups first-time buyers by the channel that brought them. Then it tracks repeat orders over three months. As a result, it can see which channel brings buyers who come back, not just buyers who convert once.
- A software company tracks revenue. The finance team groups customers by the month they started paying. Then it watches how spend from each group changes. This links cohort work to customer lifetime value.
Cohort Analysis vs Segmentation and Funnel Analysis
| Point | Cohort analysis | Segmentation | Funnel analysis |
|---|---|---|---|
| Main question | How does each group behave over time? | How do different types of users compare? | Where do users drop out of a set path? |
| How users are grouped | By a shared start, often a date | Any trait, such as device or location | Steps they complete |
| Time view | Built in: week 1, week 2 and so on | Usually one period | One journey, step by step |
| Best for | Retention and repeat value | Targeting and reporting | Fixing sign-up or checkout steps |
How to Run a Cohort Analysis in GA4
- Pick one question. For example, “Do users from our new campaign come back as often as older users?”
- Open Explore. In Google Analytics 4, go to Explore and start a Cohort exploration.
- Set cohort inclusion. Choose the entry rule, such as first touch or a first purchase.
- Set return criteria. Choose what counts as coming back, such as any event or a purchase.
- Choose granularity. Pick daily, weekly or monthly. Weekly is a good start for most sites.
- Choose the calculation. Select standard, rolling or cumulative, based on your question.
- Add a breakdown. Split cohorts by a dimension, such as device or first user source.
- Read and act. Compare rows and columns. Then agree one change to test, and check the next cohorts.
Best Practices for Cohort Analysis
- Start with a clear goal. Know what “coming back” means for your business before you build the table.
- Compare equal periods. Judge each cohort at the same age, so the comparison is fair.
- Watch cohort size. Small groups swing a lot, so don’t draw big conclusions from a handful of users.
- Use meaningful splits. Break cohorts down by channel or device to find where the gaps are, using segmentation ideas.
- Note what changed. Keep a log of launches and campaigns, so you can link shifts to real events.
- Share simple views. Put key cohort charts in a marketing dashboard that others can read quickly.
Common Mistakes to Avoid
- Reading the latest cohorts too early. Recent groups have not had time to return yet, so their numbers look lower.
- Mixing up calculation types. Rolling and cumulative numbers look very different from standard ones.
- Using only totals. Overall active users can grow while each new cohort gets worse.
- Too many splits at once. Lots of breakdowns make tiny groups and noisy results.
- No follow-up action. A cohort table is only useful if it changes what you do next.
Where You’ll Use Cohort Analysis at Work
Cohort analysis appears in data, growth and finance roles, often next to funnel and retention work. For example, real remote job listings ask for:
- “Drive end to end product and growth analyses including funnel analysis, cohort analysis, retention, segmentation, monetization, and experimentation.” (Senior Data Analyst (Product Analyst)).
- “Strong understanding of KPI design, metric definitions, funnel analysis, cohort analysis, segmentation, trend analysis, forecasting, and root-cause analysis.” (Senior Data Analytics Specialist).
- “Establish and maintain a trusted SaaS/ARR reporting framework, including NRR, cohort analysis, CAC/LTV, and unit economics.” (Senior Manager FP&A).
Learn It in the Google Ads and Analytics Track
You can learn cohort analysis and wider GA4 reporting in the AI-Powered Google Specialist track. Every track includes a U.S. Project Internship from day one, with unlimited 1-on-1 mentoring.
Frequently Asked Questions
What is a cohort in marketing?
A cohort is a group of users who share a common trait. Most often, it is the date they first visited, signed up or bought.
Where is cohort analysis in GA4?
Go to Explore and choose the Cohort exploration. Then set the inclusion rule, return criteria and granularity.
What does a cohort table show?
Each row is one cohort and each column is a time step after entry. So the cells show how each group behaves as it ages.
How is cohort analysis different from segmentation?
Segmentation groups users by any trait for one period. By contrast, cohort analysis groups users by a shared start and follows them over time.
Do I need coding skills for cohort analysis?
No. Tools such as GA4 and Mixpanel build cohort tables for you. However, analysts may also use SQL for custom cohorts.
Sources: Google Analytics Help: Cohort exploration; Google Analytics Help: Get started with explorations; Mixpanel Docs: Retention; remote job listings on Himalayas, Himalayas and Himalayas.