
Marketing return on investment tells you whether a campaign paid for itself. But one ROI number hides which channel, audience or creative actually drove the result. This guide shows how marketing return on investment gets calculated. It also shows why the number reads differently by channel, and the one rule that stops you trusting a misleading figure.
Key Takeaways
- Marketing budgets now sit at just 7.7% of company revenue. That is according to a Gartner CMO Spend Survey of 402 CMOs and marketing leaders, mostly at companies over $1 billion in revenue. 59% say their budget is not enough to execute their current strategy.
- Only 22% of senior marketers in a 167-respondent survey say they strongly feel they have the data to justify marketing’s value to their CFO. Every company in that survey spends $1 million or more a year on ads.
- HubSpot’s survey of more than 1,500 marketers found measuring marketing ROI is the single most cited challenge. 33% of respondents named it, ahead of every other obstacle on the list.
- A rule drawn from thousands of effectiveness case studies recommends roughly 60% of budget on long-term brand building and 40% on short-term activation. The two work on different timescales, so a single-period ROI number only sees half the picture.
- A lifetime-value-to-acquisition-cost ratio above 3:1 is the floor for a healthy channel in David Skok’s widely used SaaS metrics framework. The best performers hit 7:1 to 8:1. That gives marketing ROI a second number to check against, not just one.
In this guide
- Most Marketing Return On Investment Reporting Answers The Wrong Question
- How Marketing Return On Investment Actually Works
- Marketing ROI Looks Different By Channel
- Fix The Blind Spot In Each Channel’s ROI
- How To Measure Marketing ROI Without Fooling Yourself
- The One Marketing Return On Investment Rule: Match Your Window To Your Sales Cycle
- Frequently Asked Questions About Marketing Return On Investment
- Build Measurement Skills, Not Just Reports
Most Marketing Return On Investment Reporting Answers The Wrong Question
Ask a room of marketers whether their campaigns show a return, and most will say yes. Ask them to defend that number to a finance team, and the room gets quieter. Only 22% of senior marketers in a Perion and Advertiser Perceptions survey of 167 senior marketers strongly felt they had the data to justify marketing’s value to their CFO. Every company surveyed spends $1 million or more a year on ads.
That gap is not a reporting problem. It is a measurement problem. A single marketing return on investment figure, reported alone, compresses dozens of channels, audiences and time horizons into one number. Then it asks that number to answer questions it was never built to answer. Getting the underlying marketing budget structured around how each channel pays back is the first step toward a marketing return on investment figure worth defending.
Ground Rules For This Guide
This guide treats marketing ROI as a family of related numbers, not one metric. What follows is an informed framework built from publicly reported research. It is not a settled formula that works identically for every business; your sales cycle, margin and channel mix will shift the exact figures. Some of the data below is self-reported by survey respondents. Some comes from a single vendor-published case study. All of it is a snapshot of current practice, not a permanent ranking of channels. How we checked this: every figure below was opened at its original source, not taken from a summary page, and each one carries the limits the source itself states, such as sample size, region or who funded the research.
How Marketing Return On Investment Actually Works
Marketing return on investment is the profit a campaign generates, divided by what it cost. The formula: (revenue attributed to marketing minus marketing cost), divided by marketing cost. A campaign that costs $10,000 and drives $40,000 in attributed revenue has a 3:1 return, or 300%, before you even touch gross margin. That formula looks simple. The part that breaks it is the phrase “revenue attributed to marketing.” Attribution is a judgment call, not a fact.
The Attribution Model And The Measurement Window
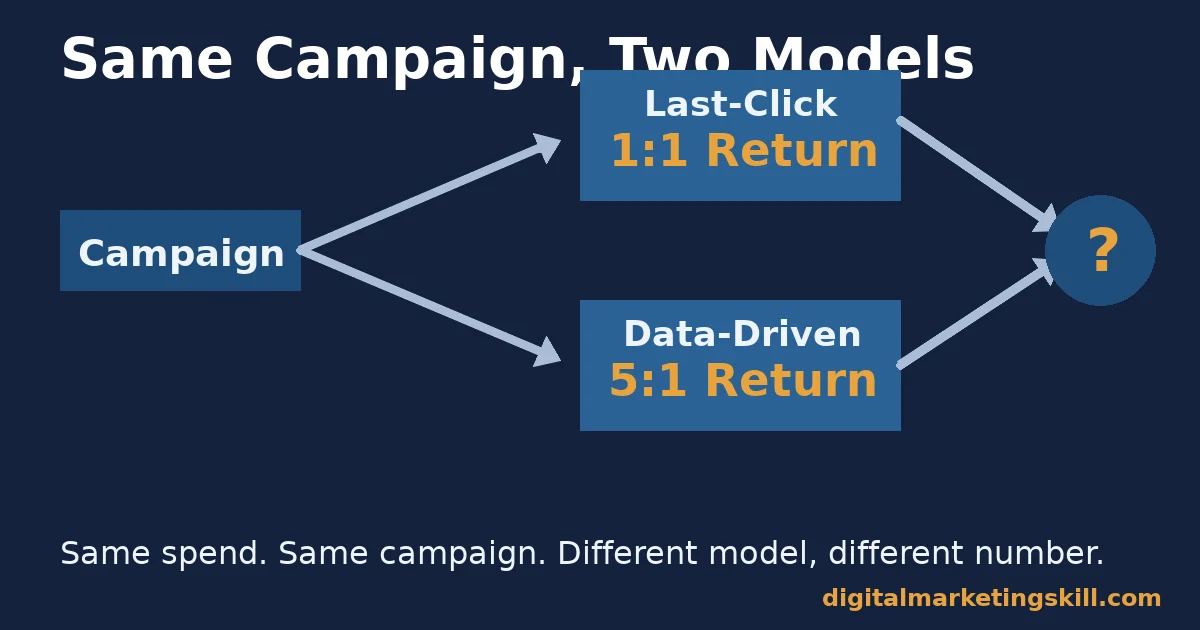
Two choices decide what that number says: the attribution model, and the measurement window. The model decides which touchpoints get credit. The window decides how long after exposure you still count the result. Change either one, and the same campaign can show a 5:1 return or a 1:1 return. Not a single dollar of spend has to change. Google’s own documentation on data-driven attribution describes a model that spreads fractional credit across the touchpoints in a user’s path. It does not hand all the credit to the last click. That is one honest answer to the attribution question. Last-click reporting, which many smaller teams still default to because it ships with every ad platform, is another, cruder answer. The two will disagree on which channel “worked.” Whichever model you choose, it should sit inside a wider web analytics stack you actually trust, not one platform’s self-reported dashboard.
Marketing Mix Modeling: A Different Approach
Marketing mix modeling takes a different approach again. It works backward from total sales. It separates a baseline you would have earned anyway from the lift marketing added, and it weighs in non-marketing factors such as price, distribution and seasonality. Nielsen’s own published guidance on the method makes the point directly: an advertising-only view of sales cannot separate what marketing caused from what would have happened anyway. That separation is exactly what a full marketing mix model is built to make. The lesson is not “pick the right model and you are done.” Every marketing ROI figure carries the fingerprints of the model that produced it. State the model whenever you report the number.
Marketing ROI Looks Different By Channel
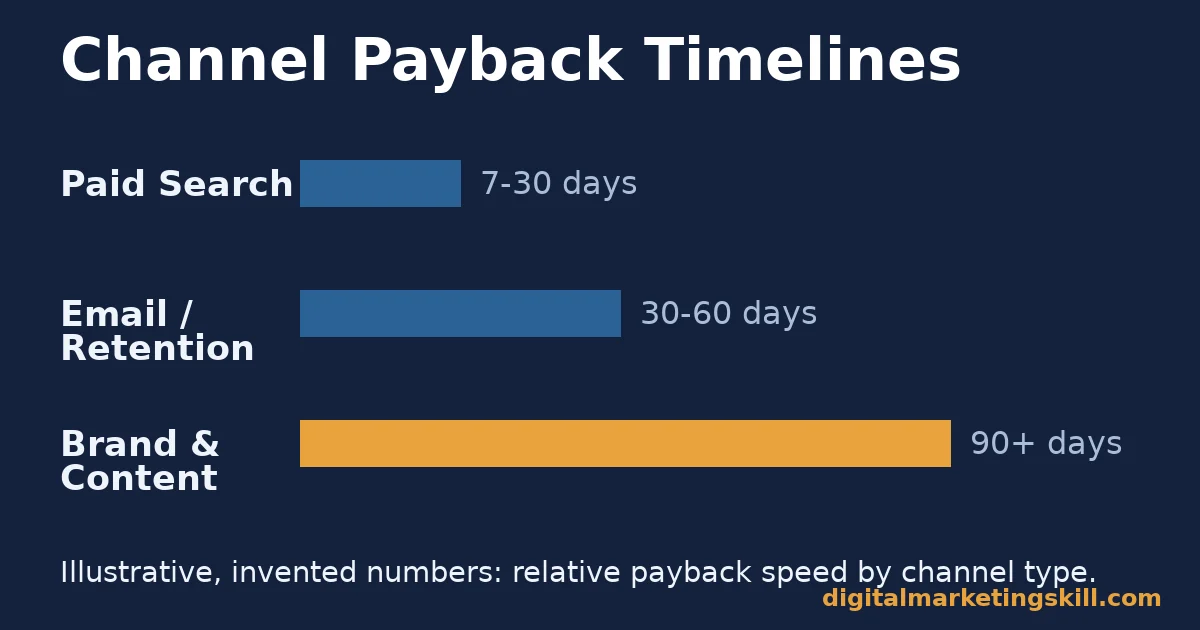
A single blended marketing return on investment number flattens three very different payback patterns into one line. Each channel family earns its return on a different clock. That is why comparing a paid search campaign to a content hub, using the same 30-day window, produces a misleading winner. The stakes are not academic. A finance team reading one blended number will cut the “underperforming” channel first. Often, that channel is simply earlier in its payback curve than the one that looks strong today.
Paid Search And Retargeting: Built For Fast, Visible Payback
Paid search and retargeting capture demand that already exists. Someone searched, clicked and, often, bought within days. The attribution window is short, and the last touchpoint sits genuinely close to the decision. That is why these channels post the cleanest ROI numbers in most dashboards: cause and effect sit close together in time. The trap is treating a clean number as a complete one. Paid search can only harvest demand that other activity created. So its ROI says little about whether that demand would have existed without the brand awareness built months earlier.
Brand And Content: Built For Compounding Payback
Brand campaigns and evergreen content pay back slowly, and keep paying. A guide published today can still be driving search traffic, and therefore pipeline, years from now. A single social post or display ad stops earning the day the budget stops. The 60/40 split reported from the IPA Databank, analysed by Les Binet and Peter Field, exists for exactly this reason: short-term activation and long-term brand building create different kinds of business results on different timescales. A 30-day ROI report structurally favors the one that pays back fast. A documented content marketing strategy makes the compounding effect easier to track, because each asset’s traffic and ranking history gives you a timeline to measure against.
Email And Retention: Built For Efficient Repeat Payback
Email, lifecycle messaging and retention campaigns run against an audience you already acquired. The marginal cost of the next send is close to zero. That makes their standalone ROI look extremely high. But it is measuring the wrong denominator if you forget the list itself was expensive to build through other channels. Retention ROI is real. It is a return on an asset, not just on this month’s send budget.
Fix The Blind Spot In Each Channel’s ROI
Knowing why a channel’s ROI reads the way it does is only useful if it changes what you measure next. Here is the specific fix for each of the three patterns above. None of these fixes require new software. They require a decision to measure the channel on its own terms, instead of forcing every channel through the same dashboard filter built for whichever channel reports fastest.
Paid Search: Lead With Incrementality Tests
Run a holdout or geo experiment. Pause the campaign in a comparable region or segment, and keep it running everywhere else. Compare the two groups. The gap between them is the incremental lift the campaign actually caused, separate from demand that would have converted anyway through organic or direct channels. This single test answers the question platform-reported ROI cannot: how much of this “return” would have happened without the spend?
Brand And Content: Lead With A Longer Measurement Window
Judge brand and content investment over quarters, not weeks. Track leading indicators alongside revenue inside your Google Analytics reports: branded search volume, direct traffic, returning-visitor share and organic ranking depth for your core topics. None of these alone proves ROI, but together they show the compounding curve a single-month figure cannot capture. They also let you tell the difference between “this isn’t working” and “this hasn’t had time to work yet.”
Email And Retention: Lead With Cohort Lifetime Value, Not Open Rates
Measure retention channels against the lifetime value of the customers they keep, not the cost of the next campaign alone. Open and click rates tell you whether a message landed. They do not tell you whether the relationship is profitable. Track cohorts of customers acquired through each channel, and compare their 12-month value. The return you report should reflect the asset, not just the activity.
How To Measure Marketing ROI Without Fooling Yourself
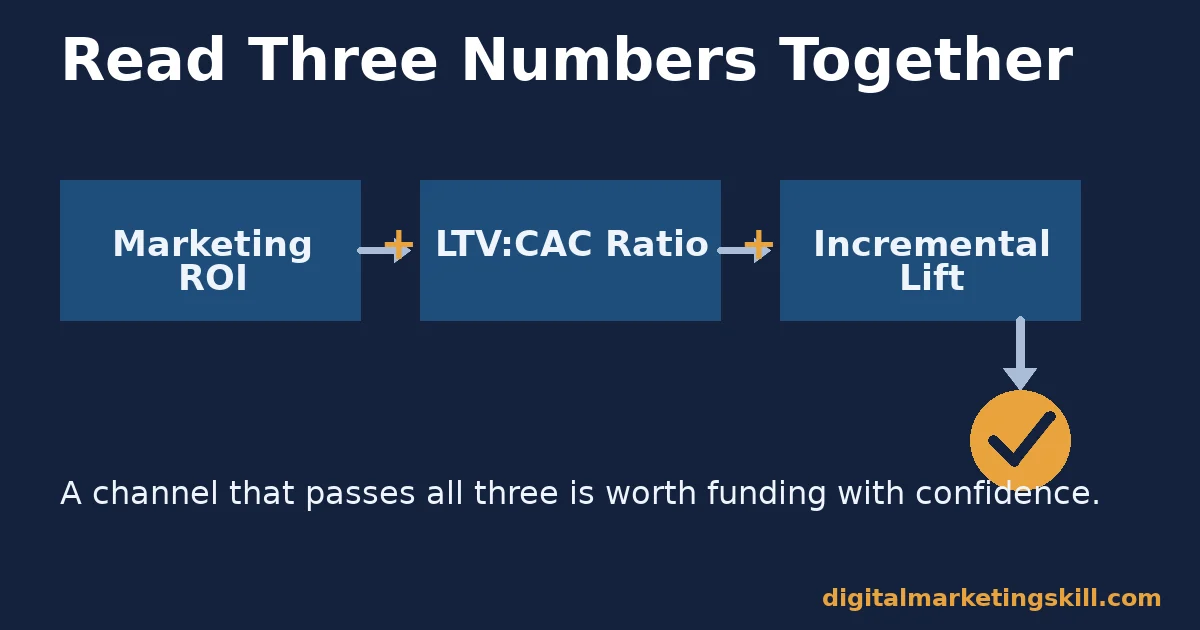
Three measurements, used together, catch most of the ways a single ROI figure misleads. None of them is hard to calculate once you have clean data. The discipline is in reporting all three together, rather than reaching for whichever one tells the story you already wanted to tell.
Marketing return on investment itself: (attributed revenue minus marketing cost), divided by marketing cost. Always read marketing return on investment next to the attribution model that produced it, because the number on its own tells you almost nothing.
LTV:CAC ratio: customer lifetime value, divided by what it cost to acquire that customer. David Skok’s widely used SaaS metrics framework is built from observing mature public SaaS companies. It treats a ratio above 3:1 as the floor for a defensible channel, and flags anything near or below 1:1 as a channel that loses money on every customer it brings in. This is the number that stops a campaign with a flashy 30-day ROI from quietly acquiring customers who never stick around long enough to be profitable.
Incremental Lift: The Causal Check
Incremental lift: the percentage difference in outcomes between an exposed group and a comparable holdout group that saw no campaign. This is the only one of the three that answers causation, not just correlation. That is why it is worth the effort of running a handful of holdout tests a year on your biggest channels.
Read these three side by side. Do not report marketing ROI in isolation. A channel with a high reported ROI, a weak LTV:CAC ratio and no measurable incremental lift is very likely harvesting demand it did not create. A channel with a modest reported ROI but a strong LTV:CAC ratio and real incremental lift is probably underfunded, not underperforming.
The One Marketing Return On Investment Rule: Match Your Window To Your Sales Cycle
Before you trust any marketing ROI figure, check one thing. Does the measurement window at least match how long your buyers actually take to decide? A campaign for a product with a same-day purchase decision can fairly be judged on a 7 to 30-day window. A campaign supporting a B2B product with a typical 90-day sales cycle cannot. Most of the revenue it influenced has not closed yet.
Illustrative, invented numbers: picture a $20,000 content campaign for a product with a 90-day average sales cycle. Measured 30 days after launch, attributed revenue might show $18,000. That is a 0.9:1 return, which looks like a loss. Measured across the full 90-day cycle, once deals that started in week one finish closing, attributed revenue might reach $71,000. That is a 2.55:1 return, so the spend never changed. Only the window did. Before you cut a channel for a weak ROI number, confirm the window was long enough to see the result, not just the start of it.
A Real Example: One Change, One Verified Result
A real example of a single, well-measured change producing a verified swing: Wingify’s published case study on PriceCharting covers one e-commerce company. It changed one call-to-action button’s text from “Download” to “Price Guide,” and removed a price display next to it. Clickthroughs rose 620.9% at 99.9% statistical confidence within about a week. That result came from one company’s own A/B test and will not repeat at that scale everywhere. But it shows the kind of clean, fast ROI signal you get when you isolate one variable and measure it correctly, instead of blending ten changes into one monthly report.
Frequently Asked Questions About Marketing Return On Investment
What is marketing return on investment and how is it different from regular ROI?
Marketing return on investment uses the same formula as any ROI calculation: profit divided by cost. It just applies that formula specifically to marketing spend and the revenue attributed to it. The practical difference is this: the revenue side depends on an attribution model and a measurement window, and both are choices. So two people can calculate marketing ROI correctly and still get different answers from the same campaign.
What counts as a good marketing ROI ratio?
There is no single universal number, because a good ratio depends on your margin, channel and sales cycle. A useful cross-check instead of a fixed target is the LTV:CAC ratio. Treat anything below roughly 3:1 as a channel to investigate, and anything from 3:1 to 8:1 as the healthy range most mature subscription businesses report.
Why does marketing ROI look different across channels doing similar jobs?
Because each channel pays back on a different timescale. Paid search and retargeting capture demand close to the decision, so their ROI shows up fast. Brand building and content compound slowly over months or years. Measuring all three with the same short window favors the fast-payback channels. That is why a blended, same-window comparison usually understates brand and content.
What is incrementality testing and why does it matter for ROI?
Incrementality testing pauses a campaign for a comparable holdout group, while it keeps running for everyone else. Then it compares the two groups’ results. The difference between them is the lift the campaign actually caused, separate from conversions that would have happened anyway. It matters because a reported ROI figure can look high even when true incremental lift is close to zero, if the channel was mostly capturing demand other activity had already created.
Is it a mistake to use last-click attribution for marketing ROI?
Last-click attribution is not wrong. It is narrow. It credits only the final touchpoint before a conversion, so it is a reasonable way to see what closes a sale, but a poor way to see what created the demand in the first place. Pair it with a multi-touch or data-driven model, which spreads credit across the touchpoints in a user’s path, before you make a budget decision based on last-click numbers alone.
How often should a business re-measure marketing ROI?
Match the re-measurement cycle to the channel’s own payback pattern. Fast-payback channels like paid search can be reviewed monthly. Brand and content investment needs a full quarter or more before the window is long enough to judge fairly. Re-measuring a slow-payback channel on a fast-payback schedule is one of the most common reasons a genuinely working campaign gets cut too early.
Does a high marketing ROI number always mean the campaign worked?
Not on its own, because a high ROI figure can still mean the channel mostly captured demand that already existed, instead of creating new demand. This is especially true for last-click-attributed channels close to the point of purchase. Check it against an incremental lift test or an LTV:CAC ratio before treating a strong ROI number as proof the campaign caused the result.
What is the difference between marketing ROI and ROAS?
ROAS, return on ad spend, divides revenue by ad cost and stops there. It never subtracts the cost itself, so a ROAS of 4 just means $4 of revenue per $1 spent, not $4 of profit. Marketing return on investment goes one step further: it subtracts the cost first, so the result reflects profit, not just revenue. Use ROAS to compare ad platforms quickly. Use marketing ROI when the number needs to hold up in a budget conversation.
Build Measurement Skills, Not Just Reports
Marketing return on investment is not one number you calculate once a month. It is a set of related measurements, each useful for a different question. Each is only trustworthy once you know what model and window produced it. The teams that get this right do not have the fanciest dashboard. They are the ones who ask what attribution model built the number before they act on it.
If you want to build this skill properly, rather than piece it together from blog posts, Digital Marketing Skill Institute’s Master Diploma in Digital & AI Marketing covers AI-powered Google Analytics and AI-powered Google Advertising alongside SEO, content and lead generation. It comes with unlimited one-on-one coaching and mentoring, plus real project work inside a U.S. partner company from day one. The program is dual US and UK accredited, and recognised in more than 100 countries. It is delivered 100% online, so you can build these measurement skills from anywhere in your country. Explore the full Digital Marketing Skill Institute curriculum, browse more guides on the digital marketing blog, or go straight to the application page when you are ready. Wherever you live, these measurement principles apply the same way; only the currency and the data rules change. Visit digitalmarketingskill.com to see the full range of courses inside the Master Diploma.
Every figure in this guide was checked against its original source before publication. Figures marked as illustrative are invented examples, not real results.
![9 Amazing Digital Marketing Skills to Make Money Online [With Proof]](https://digitalmarketingskill.com/wp-content/uploads/2019/07/9-Amazing-Digital-Marketing-Skills-to-Make-Money-Online-With-Proof-17.png)






