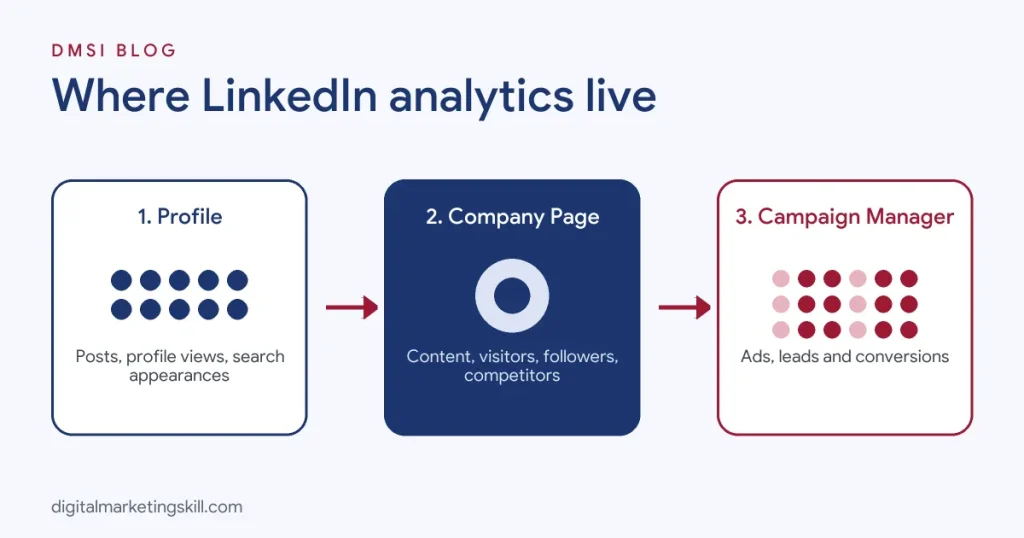
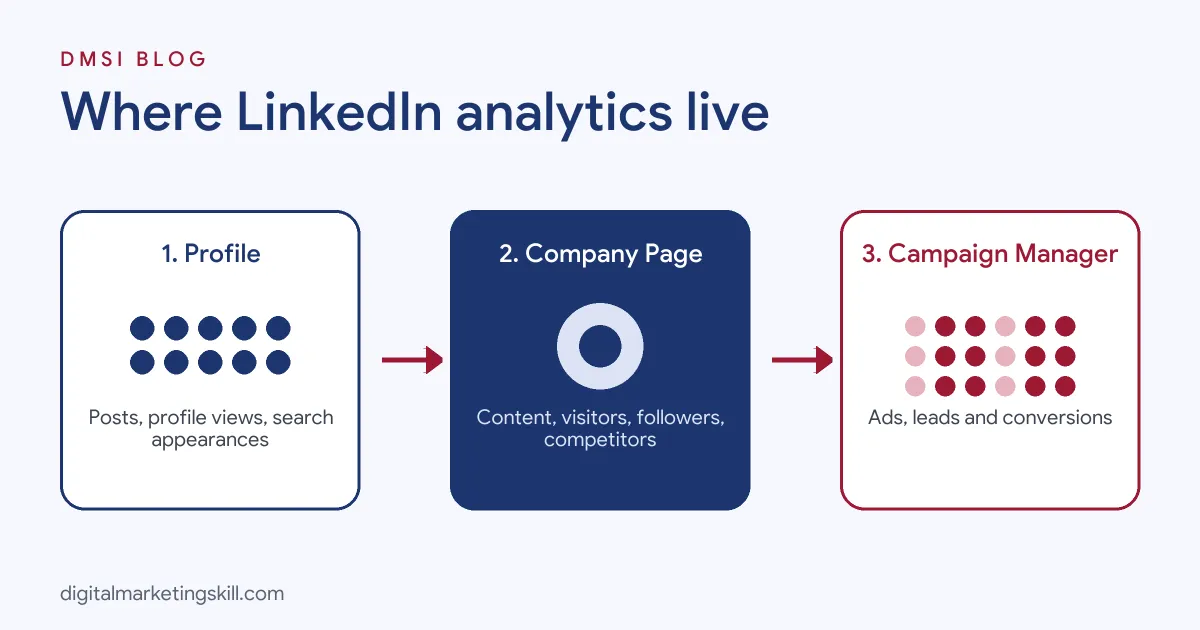
LinkedIn analytics are the built-in statistics that show how your LinkedIn profile, posts, Company Page and ads perform. There are two main places to find them. For a personal profile, open the Analytics & tools area from your profile to see post impressions, members reached, profile views, search appearances and follower growth. For a Company Page, go to the Page admin view and click Analytics to see Content, Visitors, Followers, Page appearances and Competitor data, including follower demographics by job function, industry, seniority and location. Paid campaigns are measured separately in Campaign Manager. The metrics that matter most are engagement rate, the type of people your content reaches, follower growth and the clicks, leads or conversations your activity creates.
This guide shows you where to find every type of LinkedIn analytics, what each metric means, how to judge whether your numbers are good, which tools help and how to turn the data into more reach and more leads. If you are working on your profile itself, start with our guide to LinkedIn profile optimisation.
Key Takeaways
- LinkedIn says it has more than one billion members in over 200 countries and territories.
- LinkedIn Help describes the Analytics & tools page as the central place to view your personal performance and access available tools.
- LinkedIn Page analytics are split into Content, Visitors, Followers, Page appearances and Competitor tabs, according to LinkedIn Help.
- Page follower and visitor data can be broken down by job function, industry, seniority, company size and location.
- Paid LinkedIn ads are measured in Campaign Manager, not in Page analytics.
In this guide
- What Most LinkedIn Analytics Guides Miss
- What Are LinkedIn Analytics?
- Personal Profile Analytics: Where to Find Them
- LinkedIn Page Analytics: Where to Find Them
- LinkedIn Metrics Explained
- Using Demographics to Check You Reach the Right People
- How to Tell If Your LinkedIn Numbers Are Good
- LinkedIn Ads Analytics in Campaign Manager
- Connecting LinkedIn to Website Results
- Social Selling Index and the Top 1%
- Best LinkedIn Analytics Tools
- How to Use LinkedIn Analytics to Grow
- A Simple Monthly LinkedIn Report
- Common LinkedIn Analytics Mistakes
- The One Rule for LinkedIn Analytics
- An Illustrative Case
- Frequently Asked Questions About LinkedIn Analytics
- Your Next Step
What Most LinkedIn Analytics Guides Miss
Most guides walk through the tabs and define each metric. That is useful, but it misses what makes LinkedIn different from every other social network: on LinkedIn, who sees your content matters far more than how many people see it.
- Quality of reach beats volume. A post seen by 800 marketing directors at companies you want to work with is worth more than a post seen by 20,000 random people. LinkedIn’s demographic breakdowns, by job title, seniority, industry and company, are its most valuable analytics, and many people never look at them.
- Personal profiles usually outperform Pages. People engage with people. For many businesses, the founder’s or team’s personal posts drive more reach and leads than the Company Page. Your analytics strategy should track both.
- The real results happen off the post. Profile views, connection requests, direct messages and sales conversations rarely show up in post analytics, yet they are often the point. Track them deliberately.
What Are LinkedIn Analytics?
LinkedIn analytics are the performance data LinkedIn provides for members, creators, Page admins and advertisers. They help you answer practical questions:
- Which posts reach and engage my target audience?
- Who is viewing my profile and finding me in search?
- Is my Company Page following growing, and with the right people?
- How does my Page compare with competitors?
- Are my ads producing leads at a sensible cost?
For B2B marketers, recruiters, freelancers and job seekers, LinkedIn analytics are especially useful because the audience data is professional: job functions, industries and seniority levels that no other social platform shows so clearly. Our glossary entry on LinkedIn marketing covers the wider strategy.
Personal Profile Analytics: Where to Find Them
LinkedIn Help describes the Analytics & tools page as a central place to view your performance. To get there:
- Click the Me icon at the top of LinkedIn and select View profile.
- Scroll to the Analytics section near the top of your profile. It is visible only to you.
- Click Show all analytics to open the full Analytics & tools page.
On the mobile app, open your profile and scroll to the same Analytics section. For an individual post, tap or click View analytics under the post.
What Personal Analytics Show
| Metric | What it shows | Why it matters |
|---|---|---|
| Post impressions | How many times your posts were displayed | Overall visibility |
| Members reached | Unique members who saw your posts | How many different people you are getting in front of |
| Engagements | Reactions, comments and reposts | Whether your content resonates |
| Profile viewers | How many people viewed your profile, and some of who they are | Interest in you as a professional |
| Search appearances | How often you appeared in LinkedIn search, plus searchers’ job titles and companies | How discoverable your profile is |
| Followers | Total followers and new followers over time | Growth of your audience |
| Post demographics | Top job titles, locations, industries and companies of viewers | Whether you reach the right people |
Some details, such as the full list of who viewed your profile, depend on your privacy settings and whether you have a Premium subscription.
Creator Tools and Personal Analytics
LinkedIn has folded many former creator features into standard profiles, so most members can see follower analytics and post performance without special settings. If you post regularly to build a personal brand, check post demographics after every few posts: they show whether your content is reaching recruiters, buyers, peers or a random mix. Our guide on using LinkedIn for professional growth explains how to build that audience.
LinkedIn Page Analytics: Where to Find Them
If you manage a Company Page, LinkedIn Help explains the steps:
- Go to your Page admin view. You need an admin or analyst role.
- Click Analytics in the left menu.
- Choose Content, Visitors, Followers, Page appearances or Competitors.
- Set the date range and filters, then export data where needed.
What Each Page Analytics Tab Shows
| Tab | Key data | Use it to |
|---|---|---|
| Content | Impressions, reach, reactions, comments, reposts, clicks, click-through rate, engagement rate and video views per post | Find your best-performing posts and formats |
| Visitors | Page views, unique visitors, device type and visitor demographics | Understand who checks out your company |
| Followers | Total and new followers, organic vs sponsored, and follower demographics | Track audience growth and quality |
| Page appearances | How often your Page appears in search and elsewhere on LinkedIn | Measure discoverability |
| Competitors | Follower growth and engagement compared with Pages you choose | Benchmark against similar companies |
Larger organisations may also see analytics for lead generation forms, newsletters, events and employee advocacy features where these are enabled.
LinkedIn Metrics Explained
Understanding a few core metrics helps you read any LinkedIn report.
- Impressions: the number of times your content was shown on screen. One person seeing a post twice counts as two impressions.
- Members reached (or reach): the number of unique members who saw your content. Reach is always equal to or lower than impressions.
- Reactions, comments and reposts: the social actions people took. Comments and reposts are usually stronger signals than reactions, because they take more effort and spread your post.
- Clicks: clicks on your content, company name or logo, including links. Important if you want traffic.
- Click-through rate (CTR): clicks divided by impressions. Shows how compelling your link or call to action is.
- Engagement rate: on Page analytics, LinkedIn calculates it as clicks, reactions, comments, reposts and follows divided by impressions. Use it to compare posts fairly.
- Video views and watch time: how many people watched your video and for how long.
- Follower growth: new followers over a period, ideally broken down by demographics.
To calculate engagement rate yourself for a personal post, add reactions, comments and reposts (plus clicks if available) and divide by impressions. A post with 2,000 impressions and 60 engagements has a 3% engagement rate.
Using Demographics to Check You Reach the Right People
LinkedIn’s demographics are its superpower. On Page analytics, you can break followers and visitors down by job function, seniority, industry, company size and location. On personal posts, you can see the top job titles, companies and locations of viewers.
Use them to answer three questions:
- Am I reaching my target audience? If you sell HR software to mid-size companies but most viewers are students, your content or network needs adjusting.
- Which topics attract which people? Compare demographics for different posts. You may find that “how-to” posts attract practitioners while opinion posts attract senior leaders.
- Where should I focus ads? Follower demographics help you choose job titles, industries and seniority for LinkedIn ads targeting.
Write down your ideal viewer, such as “marketing managers at UK B2B companies with 50 to 500 employees,” and check monthly how much of your reach matches it.
How to Tell If Your LinkedIn Numbers Are Good
People often ask whether a number like 8,000 impressions is good. The honest answer is that it depends on your network size and goal.
- Compare with your own average. If your posts usually get 1,500 impressions, 8,000 is a strong result. If you have 50,000 followers, it may be below average.
- Look at impressions per follower or connection. This shows how well your content travels beyond your existing network.
- Prioritise engagement rate and comment quality. Ten thoughtful comments from your target audience beat hundreds of passive reactions.
- Check the demographics. High impressions from the wrong audience are not success.
- Track outcomes. Profile views, connection requests from target buyers, inbound messages and leads tell you whether LinkedIn is working.
Industry benchmarks vary widely by sector and account size, so treat any published average as a rough guide and focus on improving your own trend.
LinkedIn Ads Analytics in Campaign Manager
Paid campaigns are managed and measured in LinkedIn Campaign Manager. Key metrics include:
| Metric | What it shows |
|---|---|
| Impressions and reach | How many times and to how many people your ads were shown |
| CTR | How engaging your ad is to the audience |
| CPC and CPM | What you pay for clicks and impressions |
| Leads and lead form completion rate | Results from Lead Gen Forms |
| Conversions and cost per conversion | Website actions tracked by the Insight Tag or Conversions API |
| Demographics | Job titles, companies, industries and seniority of people who saw and clicked |
LinkedIn ads often cost more per click than other platforms, so measure cost per lead and lead quality, not just CTR. Our glossary entry on LinkedIn ads explains formats and targeting, and our guide to LinkedIn lead generation covers turning attention into pipeline.
Connecting LinkedIn to Website Results
LinkedIn shows what happens on LinkedIn. To see what happens after people click, connect your website analytics.
- Add UTM parameters to every link you share, for example
?utm_source=linkedin&utm_medium=social&utm_campaign=webinar. - Check Google Analytics 4 for sessions, sign-ups and purchases from LinkedIn.
- Install the LinkedIn Insight Tag on your site if you run ads, so Campaign Manager can track conversions and build retargeting audiences.
- Ask new leads how they found you in forms and sales calls. LinkedIn often influences decisions without a trackable click.
Social Selling Index and the Top 1%
LinkedIn’s Social Selling Index (SSI) scores members out of 100 across four areas: establishing a professional brand, finding the right people, engaging with insights and building relationships. It also shows how you rank within your industry and network, which is where phrases like “top 1% in your industry” come from.
SSI is not a direct ranking factor for your posts, but it is a useful self-check for sales professionals and anyone using LinkedIn to build business. Read our glossary entry on the Social Selling Index for how to check and improve it.
Best LinkedIn Analytics Tools
Native LinkedIn analytics are free and cover most needs. Third-party tools help with history, exports and multi-account reporting.
- LinkedIn native analytics: free for profiles, Pages and Campaign Manager.
- Shield and similar creator analytics tools: deeper historical data and dashboards for personal profiles.
- Sprout Social, Hootsuite, Buffer and Agorapulse: scheduling plus cross-platform analytics and client reports for Pages.
- Looker Studio: custom dashboards that combine LinkedIn data, through connectors, with GA4 and other channels. See Looker Studio.
- Google Analytics 4: measures traffic and conversions from LinkedIn on your website.
Before connecting third-party tools to your account, check what data they access and stick to reputable providers. See our list of social media marketing tools for more options.
How to Use LinkedIn Analytics to Grow
Data only matters if it changes what you do. Here is a practical cycle to follow every month.
- Find your top five posts by engagement rate, not just impressions.
- Look for patterns: topic, format (text, image, carousel document, video, poll), length, hook and posting time.
- Check who they reached. Keep topics that attract your target audience; reconsider ones that attract the wrong people.
- Repeat the winners with fresh angles, and test one new format or topic.
- Engage strategically. Comment thoughtfully on posts from people in your target audience. Your analytics should show more profile views from relevant job titles over time.
- Improve your profile if search appearances are low: update your headline and About section with the keywords your audience searches for.
The 4-1-1 rule is a simple way to balance content: for every six posts, share four pieces of useful content from others, one original piece of your own and one promotional post. Many creators now post more original content, but the principle of giving more value than you ask for still holds.
A Simple Monthly LinkedIn Report
Whether for yourself, your manager or a client, keep the report short.
- Headline numbers: impressions, members reached, engagement rate and follower growth compared with last month.
- Audience quality: share of reach from target job titles, industries or seniority levels.
- Top three posts: what they were and why they worked.
- Business outcomes: profile views from target roles, inbound messages, leads, website sessions and conversions from LinkedIn.
- Paid results: spend, leads, cost per lead and lead quality from Campaign Manager.
- Next month: three specific actions based on the data.
Our glossary entry on marketing reports explains how to present results clearly.
Common LinkedIn Analytics Mistakes
- Chasing impressions. Big numbers from the wrong audience do not build business.
- Ignoring personal profiles. Company Page data alone misses where much of the reach happens.
- Judging posts on reactions alone. Comments, reposts and clicks show stronger interest.
- Not tracking off-platform results. Without UTMs and lead source questions, LinkedIn’s real impact stays invisible.
- Comparing with others unfairly. Accounts with different network sizes and niches are not like-for-like comparisons.
- Checking data without acting. Make one change each month based on what you learn.
The One Rule for LinkedIn Analytics
Measure who you reach, not just how many. On LinkedIn, the right 500 people can change your career or your business. Use demographics, profile views and conversations to judge success, and let impressions be a supporting number, not the goal.
An Illustrative Case
Imagine a freelance B2B copywriter in Accra who posts on LinkedIn three times a week. Her posts average 3,000 impressions, which feels good, but she gets few client enquiries.
She opens post analytics and checks demographics. Most viewers are other freelance writers and students, not the marketing managers she wants to work with. Her most engaged posts are about writing tips for writers.
She shifts topics towards problems her ideal clients face, such as “why your SaaS homepage isn’t converting” and short teardown carousels of real landing pages. She also comments daily on posts from marketing leaders at SaaS companies and updates her headline to “B2B SaaS copywriter | Landing pages that convert.”
Three months later, impressions are slightly lower at around 2,500, but her analytics show marketing managers and founders among the top viewer job titles. Profile views from target roles double, and she lands three new retainer clients from LinkedIn conversations. Fewer impressions, better business.
This example is illustrative, not a real person, but it reflects how reading demographics can change a LinkedIn strategy.
Frequently Asked Questions About LinkedIn Analytics
Where can I see my LinkedIn stats?
For your profile, click Me, then View profile, and scroll to Analytics, then Show all. For a Company Page, go to the admin view and click Analytics in the left menu.
How do I see analytics for a single LinkedIn post?
Click or tap View analytics under your post. You will see impressions, members reached, engagement and viewer demographics.
Is 8,000 impressions a lot on LinkedIn?
It depends on your network size and usual performance. For most individuals with a few thousand connections, 8,000 impressions is a strong post. Check engagement and audience quality too.
What is the 4-1-1 rule on LinkedIn?
It is a content balance guideline: for every six posts, share four helpful posts from others, one original post and one promotional post. It reminds you to give more value than you ask for.
What does “top 1%” mean on LinkedIn?
It usually refers to your Social Selling Index ranking within your industry or network. A top 1% ranking means your SSI score is higher than 99% of people in that group.
What is a good engagement rate on LinkedIn?
It varies by industry and account size. Use your own average as the benchmark and aim to improve it, while checking that engagement comes from your target audience.
Can I see who viewed my LinkedIn profile?
Free accounts see some recent viewers, depending on privacy settings. LinkedIn Premium shows more viewers and longer history. Viewers browsing privately are not identified.
What is the difference between impressions and members reached?
Impressions count every time your content was shown, including repeats. Members reached counts unique people who saw it.
Can I export LinkedIn analytics?
Yes. Page admins can export Page analytics, and Campaign Manager exports ad data. Personal profile exports are more limited, so many creators use third-party tools for history.
Who can see LinkedIn Page analytics?
Only people with admin or analyst roles on the Page can see its analytics. Personal profile analytics are visible only to you.
Your Next Step
Reading LinkedIn analytics well is a key skill for social media managers, B2B marketers and anyone building a personal brand. The Master Diploma in Digital & AI Marketing at Digital Marketing Skill Institute includes an AI-powered Social Media Management and Advertising track and a Lead Generation and Email Automation track, alongside Google, and WordPress and SEO.
From day one, you work on a real U.S. company’s project through the U.S. Project Internship, so you finish with real results and a verified U.S. work reference letter. You also get unlimited one-on-one coaching. The program carries dual US and UK accreditation, is recognised in more than 100 countries, and runs 100% online over three months.
You can build those skills wherever you live, anywhere in your country. Read student reviews, then apply for the 65% partial scholarship to see if you qualify.
Every figure in this guide was checked against its source before publication: LinkedIn Help articles on profile and Page analytics, and LinkedIn’s published member figures. LinkedIn updates its analytics features regularly. The case above is an illustrative example, not a real result.