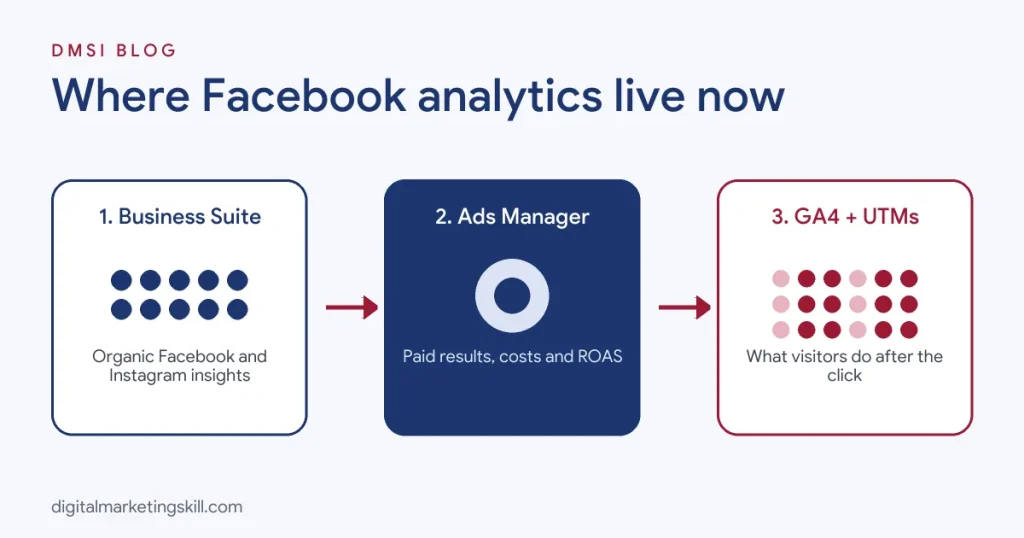
Facebook analytics means measuring how your Facebook Page, posts, Reels and ads perform, so you can see what works and improve it. Meta retired its standalone Facebook Analytics tool on 1 July 2021, so today you find your data in three places: Insights in Meta Business Suite for organic content across Facebook and Instagram, the Page’s professional dashboard for quick stats, and Meta Ads Manager for paid campaigns. The metrics that matter most are reach and views, engagement such as comments and shares, watch time on video, link clicks, follower growth and, for ads, cost per result and return on ad spend. Pair these with Google Analytics 4 and UTM links to see which Facebook activity actually leads to leads and sales.
This guide shows you where to find Facebook analytics, which metrics to track, how to read them, how to build a simple monthly report and which tools help. It pairs well with our guide to the Facebook algorithm.
Key Takeaways
- Meta says the standalone Facebook Analytics tool stopped being available on 1 July 2021.
- Meta Business Suite Insights now covers organic performance for Facebook Pages and linked Instagram accounts in one place.
- Facebook shows audience demographics such as age, gender and location once a Page has enough followers, around 100.
- Pew Research Center reports that 71% of U.S. adults use Facebook, making it one of the largest audiences to measure.
- Meta reports that more than three billion people use Facebook each month.
In this guide
- What Most Facebook Analytics Guides Miss
- What Is Facebook Analytics Today?
- Where to Find Facebook Analytics
- The Facebook Metrics That Matter
- Reach vs Views vs Impressions
- Facebook Group Insights
- Understanding Your Audience Insights
- Analysing Post and Reels Performance
- Facebook Ads Analytics in Ads Manager
- Connecting Facebook to Website Results
- Best Facebook Analytics Tools
- How to Build a Monthly Facebook Report
- Turning Facebook Analytics Into a Content Plan
- Common Facebook Analytics Mistakes
- The One Rule for Facebook Analytics
- An Illustrative Case
- Frequently Asked Questions About Facebook Analytics
- Your Next Step
What Most Facebook Analytics Guides Miss
Many articles still describe a “Facebook Analytics” tool that no longer exists, or list dozens of metrics without explaining which ones matter. That leaves marketers drowning in numbers.
- Different goals need different metrics. A Page building awareness should watch reach and views. A business selling products should watch link clicks, conversions and cost per sale. Tracking everything equally hides what matters.
- Organic and paid data live in different places. Business Suite shows organic performance; Ads Manager shows paid. Mixing them up leads to wrong conclusions.
- Facebook data stops at the click. To know whether Facebook brings customers, you need website analytics, the Meta Pixel and UTM tracking.
What Is Facebook Analytics Today?
Facebook analytics is the practice of collecting and interpreting data about your Facebook presence: who sees your content, how they react and what they do next. Since Meta retired the standalone Facebook Analytics product in 2021, the term usually refers to the insights built into Meta’s business tools.
Good analytics answers practical questions:
- Which posts and Reels reach the most people?
- What topics and formats spark comments and shares?
- Who is my audience, and when are they online?
- Is my Page growing?
- Which ads bring leads or sales at an acceptable cost?
Our glossary entry on social media analytics explains the wider discipline.
Where to Find Facebook Analytics
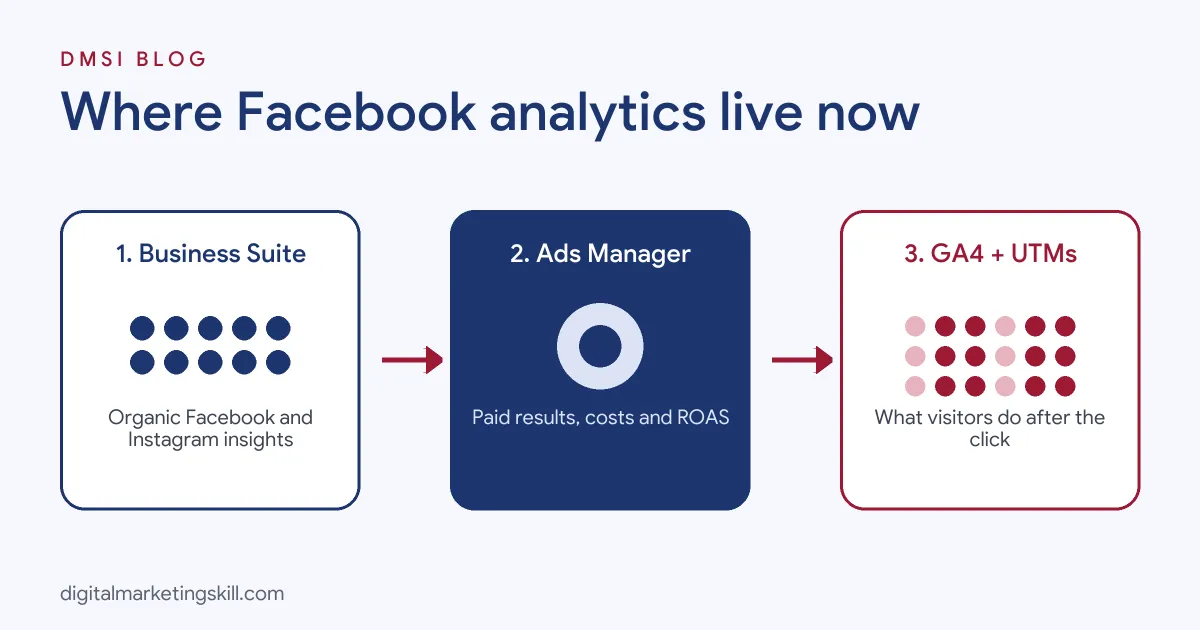
| Tool | Best for | How to open it |
|---|---|---|
| Meta Business Suite Insights | Organic Facebook and Instagram performance, audience, content and trends | business.facebook.com, then Insights in the left menu |
| Page professional dashboard | Quick stats while managing your Page | From your Page, open the professional or business dashboard |
| Meta Ads Manager | Paid campaign results, costs and conversions | adsmanager.facebook.com |
| Events Manager | Meta Pixel and Conversions API events from your website | From Business Suite, open Events Manager |
How to See Insights in Meta Business Suite
- Go to Meta Business Suite on desktop and select your business.
- Click Insights in the left menu.
- Choose the date range at the top.
- Use the Overview for headline results, Content for post-by-post performance and Audience for demographics.
- Switch between Facebook and Instagram to compare platforms.
- Export data or schedule reports where available for regular reporting.
How to See Analytics on Mobile
Open the Meta Business Suite app, or open your Page in the Facebook app and go to the professional dashboard. You will see recent reach, engagement and top content. For deeper analysis and exports, desktop is easier.
The Facebook Metrics That Matter
Meta updates metric names from time to time, but these are the core measures you will use. Our glossary entry on key performance indicators explains how to choose them.
| Metric | What it means | Use it to judge |
|---|---|---|
| Reach | The number of unique accounts that saw your content | Awareness and distribution |
| Views | How many times your content was seen or played | Overall visibility, especially for Reels and video |
| Content interactions | Reactions, comments, shares and saves | How engaging your content is |
| Engagement rate | Interactions divided by reach or views | Content quality, comparable across posts |
| Link clicks | Clicks to your website or offer | Traffic and interest |
| Watch time and average watch time | How long people watch your videos | Video and Reels quality |
| Follows and unfollows | New followers and people who left | Audience growth and content fit |
| Page visits | Visits to your Page or profile | Interest in your brand |
| Messages | Conversations started with your Page | Leads and customer service demand |
Choose Metrics by Goal
- Awareness: reach, views, reach from non-followers.
- Engagement and community: comments, shares, engagement rate, Group activity.
- Traffic: link clicks, click-through rate, website sessions from Facebook.
- Leads and sales: messages, form submissions, purchases, cost per result, return on ad spend.
Reach vs Views vs Impressions: What’s the Difference?
These three terms confuse many marketers, and mixing them up leads to misleading reports.
- Reach counts unique accounts. If one person sees your post three times, reach counts them once. Reach tells you how many different people you are getting in front of.
- Views count how many times your content was seen or played, including repeat views by the same person. Meta now uses views as a headline measure across many content types, which makes Reels, photos and text posts easier to compare.
- Impressions, still common in Ads Manager, count every time content appeared on screen. Impressions are always equal to or higher than reach.
A useful companion number is frequency: views or impressions divided by reach. A frequency of 1.2 means people saw your content a little more than once on average. In ads, a rising frequency with a falling click-through rate often signals that your audience is tired of the creative.
When you report, be consistent. Pick reach or views as your headline visibility metric and stick with it month to month, so trends are meaningful.
Facebook Group Insights
If you run a Facebook Group for your community or customers, Group admins can open Group insights from the admin tools. These show growth (new members and requests), engagement (posts, comments and reactions over time), the most active times and days, and top contributors.
Use Group insights to:
- Spot the topics and post types that start the most discussion, then schedule more of them.
- Identify active members you can thank, feature or invite to help moderate.
- Post announcements when most members are online.
- Track whether the Group is growing in quality, not just size, by watching comments per post.
Groups often drive stronger loyalty than Pages, so if your Group feeds sales or retention, include its key numbers in your monthly report. Our glossary entry on community management covers running a healthy group.
Understanding Your Audience Insights
The Audience section shows who follows and engages with your Page: age ranges, gender, top cities and countries. Facebook shows these demographics once your Page has enough followers, around 100, to protect privacy.
Use audience insights to:
- Check that you are reaching the people you want. If you sell to UK small businesses but most followers are elsewhere, adjust content and targeting.
- Find your audience’s most active times and schedule posts just before them.
- Shape your buyer persona with real data rather than guesses.
- Plan ad targeting for lookalike audiences and location settings.
Analysing Post and Reels Performance
The Content section lists every post with its reach, views, interactions and clicks. This is where you learn what to make more of.
- Sort by reach or views to find your widest-reaching posts.
- Sort by interactions or engagement rate to find the content people respond to most.
- Group posts by topic and format, for example tips, behind-the-scenes, offers, Reels and carousels, and compare averages.
- Check Reels insights for plays, average watch time and retention. A drop in the first seconds means the hook needs work.
- Look at non-follower reach. High non-follower reach means Facebook is recommending your content to new people.
- Write down lessons and turn them into next month’s content plan.
Facebook Ads Analytics in Ads Manager
For paid campaigns, Meta Ads Manager is your main analytics tool. Customise the columns to show the metrics that match your objective.
| Metric | What it shows |
|---|---|
| Results and cost per result | How many actions you got and what each cost |
| CPM | Cost per 1,000 impressions, a sign of competition and audience cost |
| CTR | How compelling your ad is to the people who see it |
| CPC | What you pay per click |
| Frequency | How often each person sees your ad; high frequency can signal fatigue |
| Conversions and CPA | Leads or sales and their cost |
| ROAS | Revenue earned for each pound or dollar spent |
To tell if a Facebook ad is performing well, compare cost per result with what a customer is worth to you, and compare each ad against your other ads. Use breakdowns by age, placement and device to find where results come from. Our guide to Facebook Ads Manager covers setup in detail.
Connecting Facebook to Website Results
Facebook’s own numbers stop at the click. To see what happens next, connect three pieces:
- The Meta Pixel and Conversions API send website actions such as leads and purchases back to Meta, improving ad optimisation and reporting.
- UTM parameters on every link you share tell Google Analytics exactly which post or ad brought each visitor.
- Google Analytics 4 shows what Facebook visitors do on your site, from pages viewed to purchases.
For example, tag a link like this: ?utm_source=facebook&utm_medium=social&utm_campaign=spring_offer. In GA4, you can then see sessions, leads and revenue from that exact campaign.
Facebook Analytics for Freelancers and Agencies
If you manage Facebook for clients, analytics is how you prove your value and keep the account. Ask clients to add you to their Meta Business portfolio with the right permissions rather than sharing passwords, so you can see insights, run ads and access Events Manager safely. Agree the goal and the three or four headline metrics at the start, record a baseline from the previous three months, and send the same short report every month. Clients rarely want every number; they want to know what changed, why, and what you will do next. Showing a steady rise in the metrics tied to their goal, with clear lessons each month, builds trust and makes it easier to raise your rates or win referrals.
Best Facebook Analytics Tools
Native tools are free and cover most needs. Third-party tools help when you manage several accounts or want polished reports.
- Meta Business Suite: free organic insights for Facebook and Instagram.
- Meta Ads Manager: free, detailed paid performance data.
- Google Analytics 4: free website analytics to measure traffic and conversions from Facebook.
- Looker Studio: free dashboards that combine Facebook, GA4 and other data with connectors. See Looker Studio.
- Sprout Social, Hootsuite, Agorapulse and Buffer: scheduling plus cross-channel analytics and client reports.
- Metricool: analytics and scheduling popular with freelancers and small agencies.
For a broader list, see our guide to social media marketing tools.
How to Build a Monthly Facebook Report
A clear monthly report helps you, your boss or your client make decisions. Keep it to one or two pages.
- Headline results: reach, views, engagement, link clicks and follower growth compared with last month.
- Top three posts: what they were and why they worked.
- Weakest posts: what underperformed and what you learned.
- Audience notes: changes in demographics or active times.
- Paid results: spend, results, cost per result and ROAS.
- Business impact: leads, sales or enquiries from Facebook, using GA4 and UTM data.
- Next month’s actions: three specific changes based on the data.
Our glossary entry on marketing reports explains how to present results clearly, and a marketing dashboard can automate much of it.
Turning Facebook Analytics Into a Content Plan
Numbers only help if they shape what you post next. This simple five-step framework turns a month of data into a plan.
- Collect. Export the last 30 to 90 days of posts with reach, views, interactions, link clicks and watch time.
- Label. Tag each post with its topic, such as tips, offers, behind the scenes or customer stories, and its format, such as Reel, photo, carousel, link or live.
- Compare. Calculate the average engagement rate and link clicks for each topic and format. Averages beat single viral posts as a guide.
- Decide. Keep the top two topic and format combinations, cut or rework the weakest and pick one new idea to test.
- Plan. Build next month’s content calendar around those decisions, then repeat the cycle.
Over a few months, this habit compounds. You spend less time on content that does not work and more on content your audience genuinely values, which in turn helps the Facebook algorithm show your posts to more people.
Common Facebook Analytics Mistakes
- Chasing likes. Likes are easy to get and weak signals. Focus on comments, shares, clicks and conversions.
- Comparing different date ranges unfairly. Compare like with like, such as month to month or campaign to campaign.
- Ignoring context. A holiday, a news event or an ad boost can change numbers. Note these in your report.
- Not tagging links. Without UTM parameters, you cannot prove Facebook drove sales.
- Judging ads too early. Give campaigns time to exit the learning phase before deciding.
- Collecting data but not acting. Analytics only matters if it changes what you do next.
The One Rule for Facebook Analytics
Measure what connects to your goal, then act on it. Pick the three or four metrics that show progress towards awareness, engagement or sales, review them monthly and make one clear change each time. Data that does not change decisions is just decoration.
An Illustrative Case
Imagine a small online bookshop in Leeds that posts daily on Facebook. The owner feels busy but cannot tell what works.
She opens Business Suite Insights and sorts three months of posts by engagement rate. Book recommendation Reels average three times the engagement of plain product photos, and “staff picks” posts drive the most link clicks. Audience insights show most followers are 35 to 54 and most active around 8 p.m.
She shifts to four recommendation Reels and two staff picks posts a week, posts at 7:30 p.m. and tags every link with UTM parameters. In GA4, she sees Facebook sessions rise and, for the first time, can attribute specific orders to Facebook posts. She also stops boosting product photos and boosts her best Reels instead, cutting her cost per sale.
This example is illustrative, not a real business, but it shows how simple analysis turns into better decisions.
Frequently Asked Questions About Facebook Analytics
How do I see analytics on Facebook?
Open Meta Business Suite on desktop and click Insights, or open your Page’s professional dashboard in the Facebook app. For ads, use Meta Ads Manager.
Is Facebook Analytics still available?
No. Meta retired the standalone Facebook Analytics tool on 1 July 2021. Insights in Meta Business Suite and Ads Manager replaced it.
What replaced Facebook Analytics?
Meta Business Suite Insights for organic content, the Page professional dashboard for quick stats, and Meta Ads Manager plus Events Manager for ads and website tracking.
How much is 1,000 views on Facebook worth?
There is no fixed amount. Earnings depend on the monetisation programme, audience location, content type and advertiser demand, and Meta does not publish a standard rate.
What is the 20% rule on Facebook?
It was an old guideline limiting text on ad images to 20%. Meta removed the strict rule, but ads with less text often still perform better, so clean images are recommended.
How do I tell if a Facebook ad is performing well?
Compare cost per result and ROAS with your targets and with your other ads. Check CTR and frequency to spot weak creative or fatigue.
Can I see who viewed my Facebook Page?
No. Facebook shows aggregated data such as reach and demographics, but not the identities of individual viewers.
What is a good engagement rate on Facebook?
It varies by industry and audience size. The most useful benchmark is your own average: aim to improve it month by month.
Can I export Facebook analytics?
Yes. Business Suite and Ads Manager let you export data, and some reports can be scheduled. Third-party tools can automate exports and dashboards.
How often should I check Facebook analytics?
Glance weekly to catch problems, and do a full review monthly. Check ads more often, especially in the first days of a campaign.
Your Next Step
Reading analytics and turning data into decisions is one of the most valuable marketing skills. The Master Diploma in Digital & AI Marketing at Digital Marketing Skill Institute includes an AI-powered Social Media Management and Advertising track and a Google track covering GA4, alongside Lead Generation and Email Automation, and WordPress and SEO.
From day one, you work on a real U.S. company’s project through the U.S. Project Internship, so you finish with real results and a verified U.S. work reference letter. You also get unlimited one-on-one coaching. The program carries dual US and UK accreditation, is recognised in more than 100 countries, and runs 100% online over three months.
You can build those skills wherever you live, anywhere in your country. Read student reviews, then apply for the 65% partial scholarship to see if you qualify.
Every figure in this guide was checked against its source before publication: Meta’s Business Help Center and Facebook Help Center, Meta’s reported user figures and Pew Research Center. Meta updates metric names and tools regularly. The case above is an illustrative example, not a real result.